
Font size
 Worksheets
Speed-Time and Velocity-Time Graphs
Total questions: 20
Worksheet time: 12mins
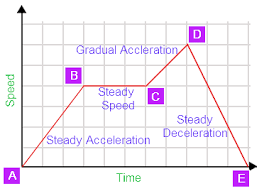
At what point is the speed the greatest?
C-D
B-C
A-B
D-E

What is happening during point C to D?
not moving
increasing speed at a constant rate
moving at a constant speed
moving at 0 m/s2 acceleration
Match the graph to the description:
"The car is accelerating at a constant rate."
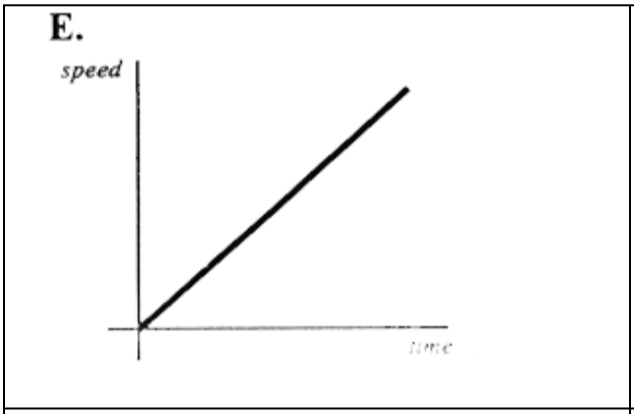
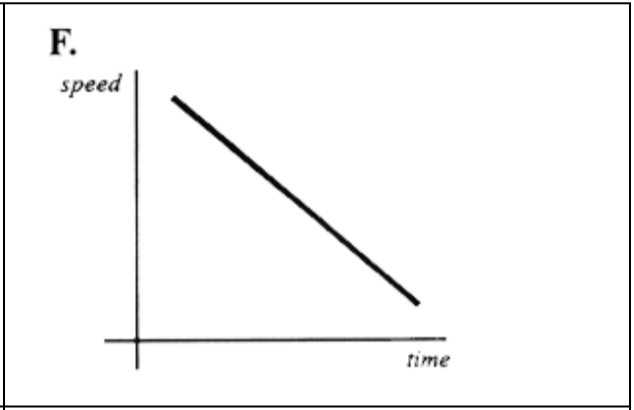
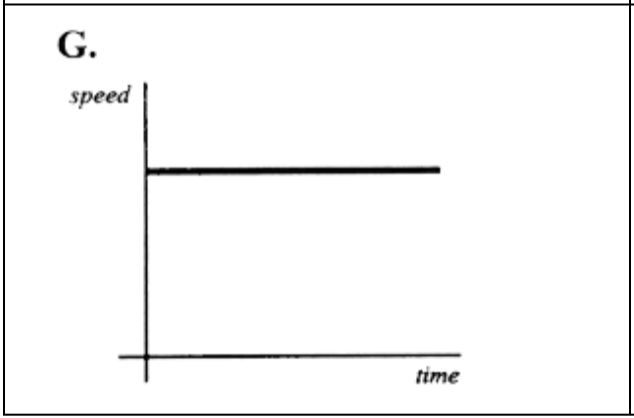
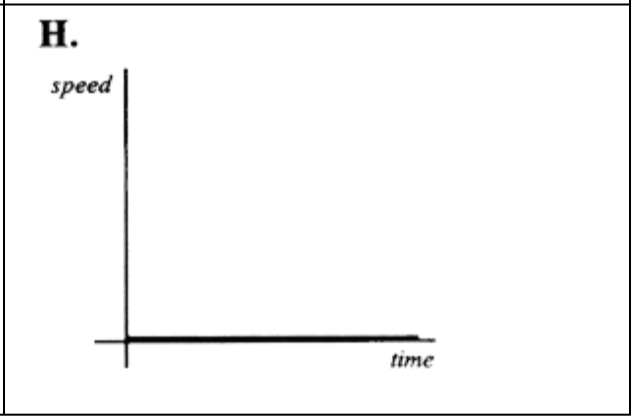
Match the graph to the description:
"The car is slowing down."

What is this graph showing?
Constant speed
Gradually speeding up
Gradually slowing down
At rest
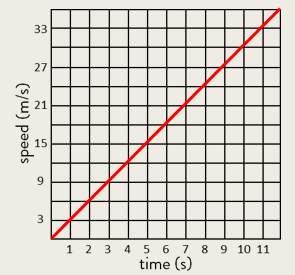
Accelerating gradually
Stopping
Slowing down constantly
Speeding up constantly

What is the graph showing?
Constant high speed
Stopped
Accelerating
Constant low speed
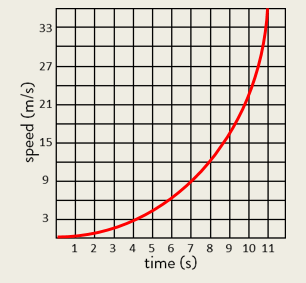
What is this graph showing?
Gradually slowing down
Gradually speeding up
Constant speed
Stopped

What is this graph showing?
At rest
Acceleration
Constant speed of 1 m/s
Gradually speeding up


Which section represents a steady speed?
A
B
C
D

Calculate the distance travelled in section C.
(a)

Explain the motion from 1-3s
Stationary
Constant speed
Constant acceleration
Non-constant acceleration
Explain the motion from 3-5s
Stationary
Constant speed
Constant acceleration
Non-constant acceleration
Explain the motion from 5-7s
Stationary
Constant speed
Constant acceleration
Constant deceleration
Explain the motion from 8s onwards. The blue line runs along the x-axis. Hint: What is the velocity from 8s onwards.
Stationary
Constant speed
Constant acceleration
Constant deceleration

Where is the acceleration the highest?
0-1s
1-3s
3-5s
Calculate the total distance traveled in the first 3s.
(a)

What is the displacement ( Δx ) during the first three seconds?
+2m
+3m
+5m
+6m

