
NEW
Font size
 Worksheets
Position vs. Time Graphs
Total questions: 20
Worksheet time: 29mins
The location of an object related to a zero point.
position
speed
distance
displacement
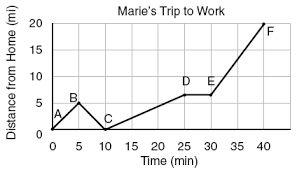
When was Marie driving the fastest?
C to D
D to E
E to F
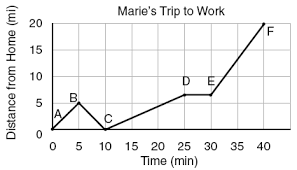
During what period of time was Marie stopped?
0-5 minutes
5-10 minutes
10-25 minutes
25-30 minutes
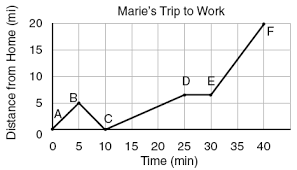
What could account for Marie’s motion at 27 minutes?
She was late so she broke the speed limit
She forgot something at home and ran back to get it
She was stopped at a red light
She was driving across the top of a hill
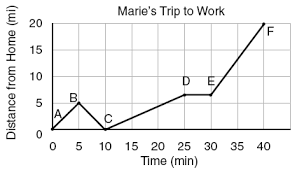
How does her speed at 3 minutes compare with her speed at 7 minutes?
She is driving faster at 3 minutes.
She is driving faster at 7 minutes
She is driving forward at 3 minutes and back at 7.
She is moving up at 3 minutes and down at 7 minutes
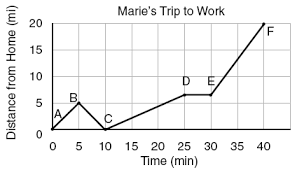
It usually takes Marie 30 minutes to get to work. Did her trip take...
The average amount of time.
Longer then average amount of time.
Shorter then average amount of time.
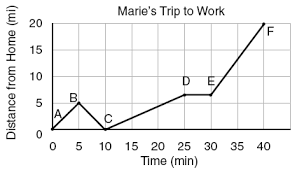
How far away is Marie's work from her house?
40 mi
25 mi
20 mi
5 mi
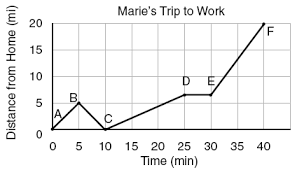
What could be a possible explanation for why Marie turned around at point B.
She arrived at work.
She forgot her lunch
She was waiting at a stop light.
She was sick and went home to sleep.
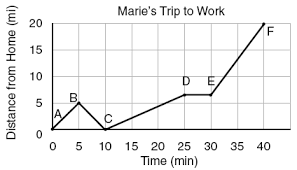
How far did Marie go before she turned around?
20 mi
5 mi
10 mi
25 mi

In Segment DE Marie was stopped at a red light. How long was she stopped for?
1 min.
10 min.
30 min.
5 min.
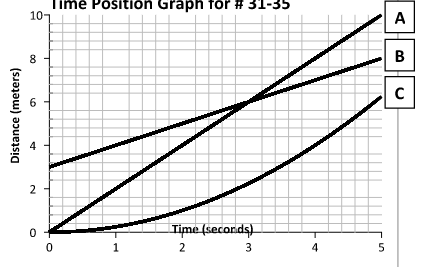

from 3rd second to 5th second, the object is
moving at a constant speed
speeding up
not moving
slowing down

What is happening at E?
Stationary
Accelerating
Fast steady speed; moving away from the starting position
Steady speed; returning to start position
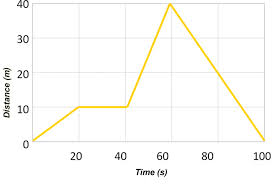

This position vs. time graph shows an object...
not moving
moving with constant velocity
moving with changing velocity

This position vs. time graph shows an object...
not moving
moving with constant velocity
moving with changing velocity

This position vs. time graph shows an object...
not moving
moving with constant velocity
moving with changing velocity
Which of these position vs. time graphs shows an object changing direction?


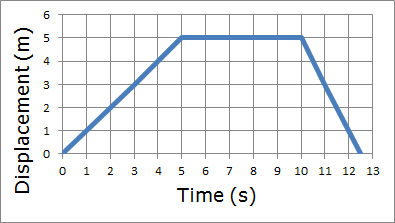
According to the graph, what was the Speed for the first 5 seconds?
1 m/s
0.5 m/s
5 m/s
2 m/s

