
 Worksheets
DATA HANDLING 6
Total questions: 10
Worksheet time: 10mins
Name
Class
Date
1.
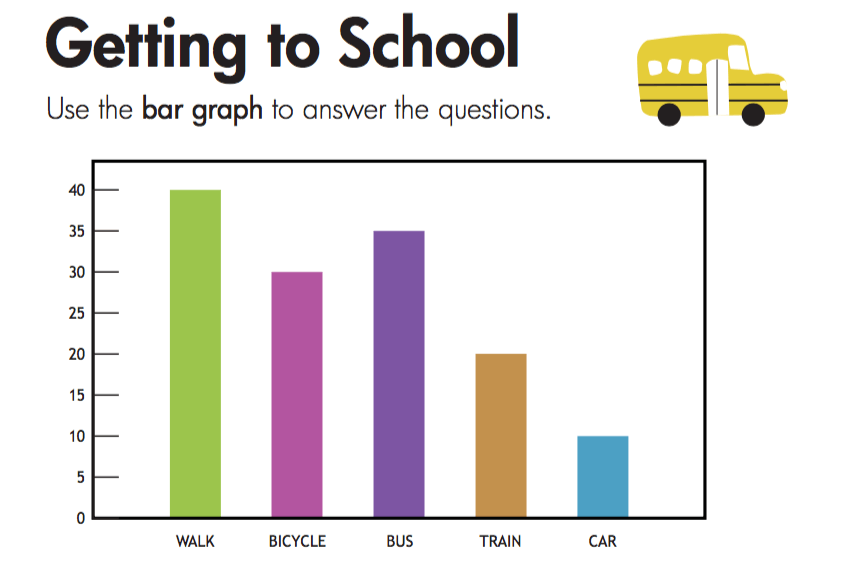
How many students ride their bicycle to school?
a)
40
b)
35
c)
30
d)
20
2.

How many students ride in a car and walk to school combined?
a)
40
b)
50
c)
10
d)
30
3.
Say 'TRUE' or 'FALSE'
Data obtained in original form is called raw data
Data obtained in original form is called raw data
a)
TRUE
b)
FALSE
4.

Which fruits is the least favorite fruits of the students? Explain.
a)
Orange is the least favorite fruits of the students because the percentage is the smallest.
b)
Peach is the least favorite fruits of the students because the percentage is the smallest.
5.

The pie chart above shows the favorite fruits of a group of students. Which fruits is the most favorite fruit among students?
a)
Grapes
b)
Pineapple
c)
Banana
d)
Peach
e)
Orange
6.

Based on the bar chart above, most of the people like to use ________
a)
TV
b)
Telephone
c)
Radio
d)
Computer
e)
Ipod
7.

What type of graph is this?
a)
bar graph
b)
pictograph
c)
tally chart
8.

How many tally marks?
a)
9
b)
6
c)
3
d)
7
9.

How many students' favorite color is blue?
a)
11
b)
12
c)
14
d)
17
10.

The bar chart in Diagram 15 shows the number of students from Year 3 to Year 6 in a school.
Which level has the most number of students?
a)
Year 3
b)
Year 4
c)
Year 5
d)
Year 6
100 %

