
 Worksheets
Unit 1 Stats CP Test Review
Total questions: 37
Worksheet time: 9hrs 15mins
Determine the variable type: What's your favorite subject in school?
Categorical
Quantitative
Determine the variable type: What is your social security number?
Categorical
Quantitative
Determine the variable type: How many states have you visited in your lifetime?
Categorical
Quantitative

If your teacher asked you to make categorical observations about the class’s pet hamster, which group of words might be used?
A mass of 3 kg, 11 cm long, age of 16 months
A mass of 3 kg, 11 cm long, cute
A long hair, white and brown colored, soft
A temperature, length, weight

What is the frequency of bus riders?
8
9
4
5

What is the relative frequency of bus riders?
around 13%
around 30%
around 4%
around 10%

What percentage of the houses are semi-detached?
60%
40%
33%

The bar graph shows the number of hamburgers sold at Bob’s Burger Shack. On which days were more than 80 hamburgers sold?
Wednesday and Friday
Tuesday and Thursday
Monday, Tuesday, and Thursday
Tuesday, Wednesday, Thursday, and Friday
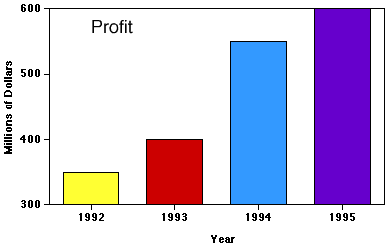
Why is this graph misleading?
x axis intervals are different
y axis intervals are different
y axis doesn't start at 0
you can't use different colors

What is wrong with this graph?
Not enough information.
The basketball ticket prices in 2001 were approximately 2 times as much as 1991, yet the size of the basketballs are about 4 times as big.
y axis scale is not uniform

What is the range for this data set?
10
15
25
30

What is the median for this data set?
22.5
30
37.5
45





What is the median test score on the 6TH Grade Math Test?
78
85
93
97
What is the the third quartile (Q3) for the data on the 6TH Grade Math Test?
68
78
85
93

Which of the following best describes the process of finding the interquartile range for a set of data?
Add the biggest and smallest numbers.
Place the numbers in order from least to greatest and find the middle.
Find the difference between the maximum and the minimum.
Subtract Q1 from Q3.
4. Which of the following lists all the five numbers needed to make a box plot?
Mean, Median, Mode, Range, and Total
Minimum, Q1, Median, Q3, and Maximum
Smallest, Q1, Q2, Q3, and Q4
Minimum, Maximum, Range, Mean, and Median
Find the median of these numbers:
2, 5, 4, 3, 7, 5, 5,
4
5
3
6


Which of the following is NOT true about the graph?
Potential outlier
Centered at about 35
skewed right
not symmetric

How would you describe the shape of the histogram?
Skewed Right
Skewed Left
Symmetrical

Which of the following measures of center should I use to describe the histogram based on its shape?
Standard Deviation
IQR
Median
Mean

What interval is the median located in?
0 -5
6-11
12-17
18-23

A value that is much higher or much lower than the other values in a set of data.
Outlier
Mean
Median
Mode
When using IQR to find outliers, which formula will identify the lower limit?
Q3 - 1.5(IQR)
Q1 + 1.5(IQR)
Q1 - 1.5(IQR)
Q3 + 1.5(IQR)
Using the information below, identify which of the following values in the answer choices is an outlier:
Q1 = 3
Q2 = 7
Q3 = 12
22
25.5
-8.5
26
Which of these could be a cumulative frequency graph?


What is the interquartile range (IQR)?
around 42
around 73
around 50
around 31
What percentile is a student who scored a 40% or below on the test?
around 50
around 22
around 40
around 80

