wayground logo

Free Printable Worksheets

Font size

S
M
L
XL
Worksheets

Data Analysis Pre-Assessment

Total questions: 168

Worksheet time: 10hrs 36mins

Name
Class
Date
1.
How many students scored more than 80%?
a)
10
b)
13
c)
7
d)
15
2.
How many students got a perfect score on the test?
a)
0
b)
2
c)
6
d)
1
3.
How many baseballs were thrown 50 or more feet?
a)
5
b)
4
c)
13
d)
8
4.
How many games did the team play?
a)
15
b)
12
c)
24
d)
14
5.
What is the minimum in this data set?
a)
0
b)
4
c)
9
d)
40
6.
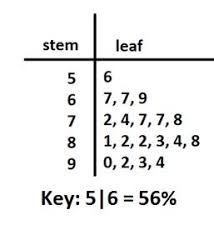
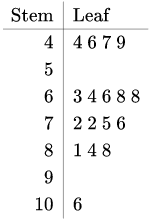
What is the highest quiz grade in the stem and leaf plot?
a)
9
b)
26
c)
92
d)
96
7.

How many scores are listed in this Stem and Leaf Plot?

a)

3

b)

6

c)

9

d)

18

8.

In how many games did the team score fewer than 10 points?

a)

3

b)

5

c)

4

d)

6

9.

Which data set goes with this stem-and-leaf plot?

a)

41,52,57,58,65,66,70,75,78,78,78,80,80,95

b)

41,52,56,58,66,70,75,78,78,78,80,80,95,56

c)

41,52,57,58,65,66,70,75,78,78,78,78,80,80,

d)

52,52,57.58,65,66,70,75,78,78,78,80,80,95
10.

This shows how many baseball cards a group of friends have in their collections. How many friends have baseball card collections with more than 70 cards?

a)

7

b)

8

c)

9

d)

4

11.

This plot show how many point was scored on a video game. What is the difference between the greatest and least amount of point scored?

a)

48

b)

39

c)

38

d)

84

12.

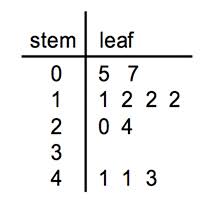
This plot show the math test scores of Ms. Lasley's class. How many students score 70% or higher?

a)

13

b)

15

c)

12

d)

14

13.

This plot show the ages of people at a birthday party. How many people at the party are 20 years of age or younger ?

a)

7

b)

6

c)

8

d)

5

14.

This plot represent the number of cookies eaten at a county fair. That was the greatest amount of cookies eaten?

a)

97

b)

100

c)

10

d)

96

15.

Data on a stem-and-leaf plot is listed in what order.

a)

Greatest to Least

b)

Least to Greatest

16.
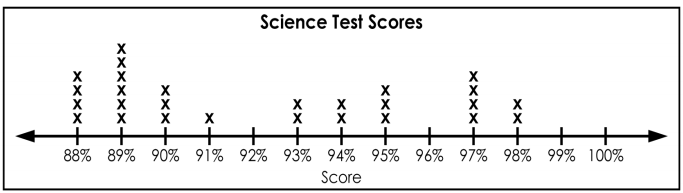
How many more students scored a 98 than scored a 88?
a)
4
b)
2
c)
6
d)
35
17.
How many students scored 93% or less?
a)
6
b)
16
c)
14
d)
13
18.
How many students received a score of 94%? 
a)
94
b)
4
c)
1
d)
2
19.
How many students spent 7 hours doing homework that week?
a)
1
b)
3
c)
5
d)
6
20.
How many total students are in the science class?
a)
13
b)
6
c)
27
d)
25
21.
Each dot represents 1 day. How many days were recorded?
a)
9
b)
21
c)
20
d)
105
22.
How many people drive SUVs?
a)
11
b)
18
c)
19
d)
22
23.
How many more students scored a 98 than scored a 88?
a)
4
b)
2
c)
6
d)
35
24.
What is the difference between the highest score and the lowest score on the test?
a)
15
b)
100
c)
6
d)
10
25.
the scores in a basketball match are as follows:
7,13,18,24,9,3,18
which score occurred most often?
a)
9
b)
13
c)
18
d)
24
26.
the following is time (in seconds) taken for five men to run in a sprint race
59,65,61,62,55
what is the mean of the time taken?
a)
60.0
b)
60.4
c)
61.0
d)
61.4
27.
What is the median?
a)
biggest- smallest
b)
average
c)
the middle #
d)
# that happens the most
28.
What is the mean?
a)
# happening the most
b)
the number in the middle
c)
biggest-smallest
d)
the average
29.
What is the mode?
a)
# happening the most
b)
the average
c)
biggest - smallest
d)
the middle #
30.
What is the range of the set: 49, 68, 62, 47, 39, 54, 43
a)
25
b)
29
c)
31
d)
19
31.
What is the mode?
100, 101, 102, 100, 101, 102, 100, 101, 102, 100
a)
100
b)
102
c)
101
d)
103
32.
The number of pages that Carolyn wrote in her journal each day from Monday to Friday is shown below: 
9, 8, 12, 6, 10
What is the mean number of pages she wrote per day?
a)
5
b)
6
c)
9
d)
11
33.
Roger bowled 7 games last weekend. His scores are: 155, 165, 138, 172, 127, 193, 142. What is the range of Roger's scores?
a)
193
b)
127
c)
60
d)
66
34.
The number of miles that Jenna cycled each week for a 7-week period is shown: 
36, 42, 28, 52, 48, 36, 31 
What is the mean number of miles Jenna cycled?
a)
31
b)
36
c)
39
d)
41
35.
Paulo got these markers in three tests: 72, 80 and 82. He had one more test to sit. He wanted an average of 80 for the four tests. What mark must he get in the fourth test?
a)
78
b)
80
c)
84
d)
86
36.
If the mean of a data set is 10, what is the missing piece of data? 
5, 4, 7, 15, 12, ___
a)
7
b)
17
c)
20
d)
16
37.
What is the range?
a)
average
b)
biggest-smallest
c)
the middle #
d)
# happening the most
38.
To find the _________ you add up all the numbers and then divide by how many numbers you have.
a)
Mean
b)
Median
c)
Mode
d)
Range
39.
What is the mode of 16,18,20,21,21,21,32,40?
a)
21
b)
56
c)
7
d)
18
40.
How many people have two or less books in their desk?
a)
4
b)
5
c)
6
d)
7
41.
What bin would 75 go into?
a)
60-70
b)
70-80
c)
75-80
d)
both red and blue
42.
What type of graph is this?
a)
Bar Graph
b)
Line Plot
c)
Pictograph
d)
Tally Chart
43.
What type of graph is this?
a)
Bar Graph
b)
Pictograph
c)
Line Plot
d)
Tally Chart
44.
What type of graph is this?
a)
Bar Graph
b)
Pictograph
c)
Line Plot
d)
Tally Chart
45.
How many students have blue for a favorite color?
a)
11
b)
12
c)
14
d)
17
46.
Which color is the most favorite?
a)
red
b)
green
c)
yellow
d)
blue
47.
What type of correlation is shown?
a)
positive linear
b)
negative non-linear
c)
negative linear
d)
positive non-linear
48.
What is the cost of one year at this university?
a)
$22,030
b)
$25,000
c)
$35,000
d)
$9,660
49.
According to the pie chart, the United States relies on fossil fuels for about what percentage of its energy?
a)
30%
b)
45%
c)
60%
d)
80%
50.

Describe the shape of the graph

a)

Uniformed

b)

Symmetrical

c)

Skewed Right

d)

Skewed Left

51.

What is the shape of the distribution?

a)

Skewed Left

b)

Skewed Right

c)

Symmetric

d)

Curved Up Shape

52.

Describe the shape of the graph.

a)

Symmetrical

b)

Skewed

c)

Uniform

53.

What is the shape of the distribution?

a)

Skewed Left

b)

Skewed Right

c)

Symmetric

d)

Uniform

54.

What is the mode in this data set?

a)

4

b)

31

c)

25

d)

10

55.

Find the mean of this data set

a)

42

b)

6

c)

7

d)

9.5

56.

What is the mode of this data set?

a)

11

b)

10.4

c)

0.9

d)

10.2

57.

What age group is the mode of this histogram?

a)

0-5

b)

6-10

c)

11-15

d)

16-20

e)

21-25

58.

What is the range of this stem and leaf plot?

a)

32

b)

5

c)

65

d)

25

59.

What is the range of this dot plot?

a)

0.9

b)

21.1

c)

10.4

d)

10.6

60.

What is the median of this data set?

a)

56

b)

52

c)

63

d)

77

61.

what is the median of this data set

a)

6

b)

9

c)

7.5

d)

7

62.

Find the spread

a)

77

b)

52

c)

55

d)

25

63.
How many students received a score in the 80's?
a)
2
b)
10
c)
14
d)
27
64.
How many scores are listed in this Stem and Leaf Plot?
a)
3
b)
6
c)
9
d)
18
65.
6. Which city has a higher median?
a)
Millersburg
b)
Arcadia
66.
7. What is Millersburg's Q3 value?
a)
200
b)
260
c)
220
d)
140
67.
Identify the outlier for the given data?
23, 34, 27, 7, 30, 26, 28, 31, 34
a)
7
b)
23
c)
31
d)
34
68.
Find the mean of these numbers:
5,11,2,12,4,2
a)
4.1
b)
6
c)
4.5
d)
4
69.
Find the median of these numbers:
4,2,7,4,3
a)
2
b)
5
c)
7
d)
4
70.
What is the mean?
a)
# happening the most
b)
the number in the middle
c)
biggest-smallest
d)
the average
71.

1. Which of the following best describes the process of finding the range for a set of data?

a)

ADD the biggest and smallest numbers

b)

Place the number in order from least to greatest then find the middle.

c)

Find the difference between the Maximum and the Minimum.

d)

Find the average.

72.
How many students have 0 Brothers and Sisters? 
a)
6 students
b)
0 students
c)
12 students
d)
10 students
73.
What is the RANGE of this data?
a)
40
b)
100
c)
60
d)
45
74.
What is the MEDIAN of this data?
a)
90
b)
20
c)
80 and 90
d)
None
75.
What is the median of the data?
a)
200
b)
100
c)
90
d)
140
76.
What value is the lower quartile (Q1)?
a)
66
b)
58
c)
60
d)
64
77.
What is the minimum value?
a)
64
b)
58
c)
66
d)
61
78.
The graph shows the results of a survey in which students were asked to name their favorite season. How many students were surveyed in all?
a)
26
b)
27
c)
16
d)
18
79.
The graph shows the number of members in four student clubs. How many more students are in the ski club than the chess club?
a)
3
b)
4
c)
5
d)
6
80.
Which car club has the higher median?
a)
Cruisers
b)
Car Hops
81.
True or False, 50% of the Cruisers attended between 7 and 16 car shows.  
a)
True
b)
False
82.
What is the range in gas mileage for SUVs?
a)
2
b)
3
c)
4
d)
6
83.
The team scored 50 points. How many points did Kendrick score?
a)
12 points
b)
20 points
c)
10 points
d)
72 points
84.
In order to find the median, the data must be sorted from least to greatest first.
a)
A. True
b)
B. False
85.

Which of the following best describes the process of finding the range for a set of data?

a)

A. ADD the biggest and smallest numbers

b)

B. Place the number in order from least to greatest then find the middle.

c)

C. Find the difference between the Minimum and the Maximum

d)

D. Find the average.

86.
What is the Q1 of this data set?
6, 7, 2, 1, 5, 2, 1, 6
a)
1
b)
1.5
c)
2
d)
2.5
87.
What is a the meaning for "median"?
a)
A. fair share
b)
B. middle
c)
C. repeats the most
d)
D. variation
88.
Which interval shows the greatest number of pets?
a)
15-19
b)
0-4
c)
5-9
d)
10-14
89.

What is the mode of the following data set?

5, 7, 7, 8, 12 , 12, 5, 6, 13, 12

a)

5

b)

7

c)

12

d)

no mode

90.

The mode is the number ________________________.

a)

you see most

b)

you see least

c)

you don't see

d)

you see first

91.

The dot plot below represents the number of hours that students spent on homework last week. What is the median of the data?

(a)  

92.

The dot plot below represents the number of hours that students spent on homework last week. What is the mode of the data?

(a)  

93.

The dot plot below represents the number of hours that students spent on homework last week. What is the mean of the data? (round to the nearest whole number)

a)

8

b)

5

c)

4

d)

3

94.

Use these test grades to answer the following question.

What is the median test grade?

(a)  

95.

Use these test grades to answer the following question.

What is the mode of the test grades?

(a)  

96.

Use these test grades to answer the following question.

What is the range of the test grades?

(a)  

97.
Find the mean.
90, 100, 95, 85, 60, 80
a)
85
b)
84
c)
86
d)
90
98.
Find the range.
5, 15, 10, 20, 15, 10, 15
a)
5
b)
10
c)
15
d)
13
99.
Find the mode.
5, 15, 10, 20, 15, 10, 15
a)
10
b)
15
c)
20
d)
5
100.
Roger bowled 7 games last weekend. His scores are: 155, 165, 138, 172, 127, 193, 142. What is the range of Roger's scores?
a)
193
b)
127
c)
60
d)
66
101.
On which day was the number of sugar cookies made at the bakery greater than the number of chocolate cookies?
a)
Monday
b)
Tuesday
c)
Thursday
d)
Saturday
102.
If you surveyed 550 students and this was your results, how many liked comedy?
a)
20
b)
55
c)
500
d)
110
103.
How many people have more than four books in their desk?
a)
7
b)
12
c)
5
d)
8
104.
 How many families are represented in the line plot?
a)
5
b)
6
c)
17
d)
18
105.
What is the median of the data?
a)
200
b)
100    
c)
90
d)
140
106.
What percentage of the data is between 90 and 140?
a)
25 %
b)
50%
c)
75%
d)
100%
107.
What is the median of the set of data?
a)
30
b)
40
c)
45
d)
50
108.
What is the minimum value?
a)
64
b)
58
c)
66
d)
61
109.
200 people interviewed
a)
50 people chose pepperoni
b)
40 people chose cheese
c)
30 people chose sausage
d)
2 people chose supreme
110.
20 people said they liked carrots out of 80 people surveyed. What percent like carrots? 
a)
20%
b)
25%
c)
16%
d)
None of these
111.
Why is this a bar chart and not a histogram?
a)
It's based on quantitative data
b)
It's based on categorical data
112.
Which interval shows the greatest number of pets?
a)
15-19
b)
0-4
c)
5-9
d)
10-14
113.
Which day of the week recorded the highest temperature?
a)
Monday
b)
Tuesday
c)
Wednesday
d)
Thursday
114.
How would you describe the change in temperature from Thursday to Friday?
a)
Increasing
b)
Decreasing
c)
No change
115.
Of the grades listed below, which grade did Jim have the fewest number of absences?
a)
Kindergarten
b)
2nd grade
c)
4th grade
d)
6th grade
116.

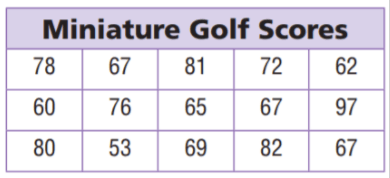
What is the range of miniature golf scores?

a)

44 points

b)

29 points

c)

33 points

d)

39 points

117.

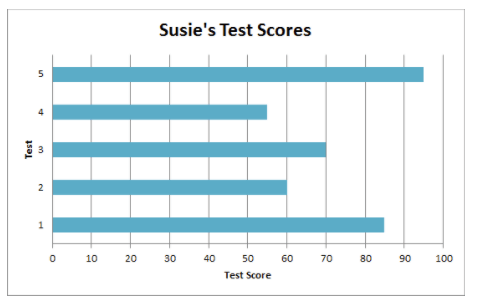
What is the range of Susie's Test Scores?

a)

40

b)

30

c)

15

d)

25

118.

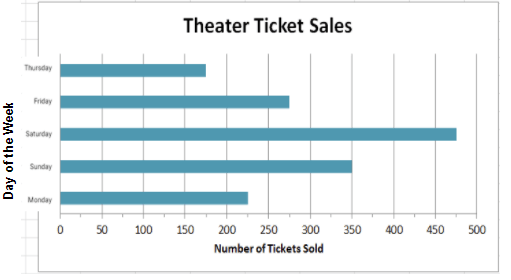
What is the range of ticket sales for the week?

a)

300 tickets

b)

325 tickets

c)

275 tickets

d)

250 tickets

119.
What is the range of this data set?
a)
54
b)
2
c)
11
d)
10
120.

Ervin bowled 7 games last weekend. His scores are: 155, 165, 138, 172, 127, 193, 142. What is the range of Ervin's scores?

a)

193

b)

127

c)

60

d)

66

121.

The scores awarded to 25 students for an assignment were as follows:

4 7 5 9 8 6 7 7 8 5 6 9 8 5 8 7 4 7 3 6 8 9 7 6 9

What is the mode?

a)

6

b)

7

c)

8

d)

9

122.
What is the mean?
a)
# happening the most
b)
the number in the middle
c)
biggest-smallest
d)
the average
123.
What is the range?
a)
average
b)
biggest-smallest
c)
the middle #
d)
# happening the most
124.
What is the mean?
a)
# happening the most
b)
the number in the middle
c)
biggest-smallest
d)
the average
125.
What is the median?
a)
biggest- smallest
b)
average
c)
the middle #
d)
# that happens the most
126.
What is the mode?
a)
# happening the most
b)
the average
c)
biggest - smallest
d)
the middle #
127.
To find the average of a set of numbers, add up all the items and divide by...
a)
2.
b)
The smallest number
c)
The largest number
d)
The number of items in the set.
128.

What is the range in gas mileage for cars?

a)

2

b)

3

c)

4

d)

6

129.
What is the MEAN for this data?
a)
80
b)
1040
c)
13
d)
81
130.
What is the mean of these numbers?
4,5,5,2,3,3,2,8
a)
40
b)
24
c)
4
d)
256
131.
Find the mean:
28, 18, 19, 18, 17
a)
20
b)
18
c)
11
d)
19
132.
What is the mean for these numbers?
5,5,5,5
a)
5
b)
20
c)
15
d)
100
133.

Calculate the mean.

2, 9, 10, 6, 8

a)

8

b)

4

c)

7

d)

22

134.
Find the median:
3, 5, 7, 4, 3, 1
a)
3 and 4
b)
There isn't one
c)
3.5
d)
3
135.
On the semester final, Joe scored 85, Jill scored 89, and Bill scored a 99.What was the average score for these students? _________
a)
91
b)
273
136.
What is the definition of the mean?
a)
The average
b)
The middle number
c)
The difference between the highest and lowest numbers
d)
The number that occurs the most
137.
Mary read six books in January, four books in February, and eight books in March.What was the average number of books read each month? __________
a)
18
b)
6
c)
14
138.
When finding the median, what do you do if there are two middle numbers?
a)
Add them together and divide by 2
b)
Write them both as the answer
c)
Give up
d)
Pick one
139.
The number of miles that Kiki cycled each week for a 7-week period is shown: 
36, 42, 28, 52, 48, 36, 31 
What is the median number of miles Kiki cycled?
a)
24
b)
36
c)
39
d)
52
140.
The cost of four cell phones are $345, $400, $110, and $640.
What is the median cost
a)
$330
b)
$390
c)
$372.50
d)
$375
141.
In order to find the median, the data must be sorted from least to greatest first.
a)
True
b)
False
142.

Christian has six grades from tests and IXL. They are all weighted equally. If Christian's grades are 100, 96, 96, 88, 70, and 100, what is the current average grade? (Round to the nearest whole number)

a)

90

b)

91

c)

92

d)

93

143.
The mode score on the 6th grade math test was 94! Which of these interpretations must be correct?
a)
99 was the highest score on the test.
b)
More students received a 94 than any other score
c)
No student scored below a 50
d)
A score of 91 was slightly below average.
144.
Lizzy had test scores of:   72, 94, 108, 60
What is the RANGE of her test scores?
a)
12
b)
72
c)
48
d)
98
145.
The number of pages that Carolyn wrote in her journal each day from Monday to Friday is shown below: 
9, 8, 12, 6, 10
What is the mean number of pages she wrote per day?
a)
5
b)
6
c)
9
d)
11
146.
What is the range?
8, 10, 60, 3, 5, 13, 12, 40, 8
a)
55
b)
8
c)
57
d)
17.7
147.
What is the mode?
a)
# happening the most
b)
the average
c)
biggest - smallest
d)
the middle #
148.

What is the range?

a)

The sum of the largest and smallest number

b)

The number in the middle

c)

The difference between the largest and smallest number

d)

The number that appears most often

149.
A data set can have more than one median?
a)
True
b)
False
150.
A data set can have more than one mode
a)
True
b)
False
151.
To find the average of a set of numbers, add up all the items and divide by...
a)
2
b)
The minimum
c)
The maximum
d)
The number of items
152.
What is the range?
a)
average
b)
biggest-smallest
c)
the middle #
d)
# happening the most
153.
What is the range?
a)
average
b)
biggest-smallest
c)
the middle #
d)
# happening the most
154.
What is the mode?
a)
# happening the most
b)
the average
c)
biggest - smallest
d)
the middle #
155.

4, 4, 7 - What is the median?

a)

4

b)

7

156.

2, 4, 5, 7, 7 - What is the median?

a)

2

b)

4

c)

5

d)

7

157.

1, 2, 2, 3, 7 - What is the mode?

a)

1

b)

2

c)

3

d)

7

158.

3, 3, 4, 6, 9 - What is the mode?

a)

3

b)

4

c)

6

d)

9

159.

9, 9, 18 - What is the mean?

a)

9

b)

18

c)

36

d)

12

160.

9, 12, 12 - What is the mean?

a)

11

b)

12

c)

9

d)

10

161.

4, 4, 4, 6, 7 - What is the range

a)

4

b)

7

c)

3

d)

6

162.

3, 3, 4, 6, 9 - What is the range?

a)

9

b)

4

c)

3

d)

6

163.

Look at these numbers - 11, 11, 7, 18, 8. What is the correct way to put them in order so you can find the median?

a)

18, 11, 11, 8, 7

b)

11, 7, 8, 18, 11

c)

8, 7, 11, 11, 18

d)

7, 8, 11, 11, 18

164.

Look at these numbers - 12, 14, 17, 8, 14. What is the correct way to put them in order so that you can find the median?

a)

17, 14, 14, 8, 12

b)

17, 14, 14, 12, 8

c)

8, 12, 14, 14, 17

d)

14, 8, 12, 17, 14

165.

The median is the __________________ number (after you put them in order).

a)

first

b)

middle

c)

last

d)

one you see most

166.

The mean is found by ___________________ all of the numbers and then _____________________ by the number of items.

a)

adding, subtracting

b)

adding, multiplying

c)

dividing, adding

d)

adding, dividing

167.

The mode is the number ________________________.

a)

you see most

b)

you see least

c)

you don't see

d)

you see first

168.

The range is found by finding the _______________ number and subtracting the ________________ number.

a)

smallest, biggest

b)

even, odd

c)

biggest, smallest

d)

middle, first