
 Worksheets
LINEAR MOTION GRAPH
Total questions: 27
Worksheet time: 16mins
Instantaneous rate of change of displacement is a definition of
Instantaneous velocity
Instantaneous acceleration
Instantaneous displacement
velocity
What value will you get if you calculate the gradient of a v-t graph
acceleration
velocity
deceleration
displacement
S2 - S1 / t2 - t1 is defined as
average velocity
instantaneous velocity
displacement
instantaneous acceleration

Describe this graph
object move to left
constant acceleration
increasing displacement
zero acceleration

Describe this graph
constant acceleration
constant deceleration
object move to the left
constant velocity

What is the similar graph with above graph?


describe this graph
zero acceleration
deceleration to right
deceleration to left
acceleration to right

Which a-t graph represent above graph?


How can we find distance traveled?
calculate area under v-t graph
calculate area under a-t graph
calculate area under s-t graph

Diagram shows a velocity-time graph for a motion of a toy car. What is the displacement of the car in 6 s?
Rajah menunjukkan graf halaju-masa bagi gerakan suatu kereta mainan. Berapakah sesaran kereta itu dalam masa 6 s?
0 m
30 m
45 m
75 m

Diagram shows a velocity-time graph for a motion of an object. What is the displacement of the object?
Rajah menunjukkan graf halaju-masa bagi gerakan satu objek. Berapakah sesaran objek itu?
12 m
18 m
24 m
36 m

Diagram shows a velocity-time graph of a bus with passengers on board. After 10 minutes, the driver steps on the brake pedal to stop the bus. What is the velocity of the passenger immediately after the brake is applied?
Rajah menunjukkan graf halju-masa sebuah bas yang membawa penumpang. Selepas 10 minit, pemandu bas menekan pedal brek untuk menghentikan bas. Berapakah halaju penumpang sebaik sahaja brek ditekan?
0 m s-1
2 m s-1
6 m s-1
72 m s-1

The diagram shows the velocity-time graph of an object. Which acceleration graph represents the same motion as the object?
Rajah menunjukkan graf halaju-masa bagi suatu objek. Graf pecutan-masa manakah yang mewakili pergerakan yang sama seperti objek itu?


The diagram shows the velocity-time graph for the movement of an object. What is the total distance, in m, that the object travels within 8 s?
Rajah menunjukkan graf halaju-masa bagi gerakan suatu objek. Berapakah jumlah jarak, dalam dalam m, yang dilalui oleh objek itu dalam masa 8 s.?
18
24
32
84

The figure shows a car moving up a hill. The car decelerates as it ascends the hill and accelerates down the hill. Which graph determines the correct relationship between velocity, v, car and time, t, for that movement?
Rajah menunjukkan sebuah kereta sedang bergerak menaiki sebuah bukit. Kereta itu menyahpecut ketika menaiki bukit dan memecut ketika menuruni bukit itu.Graf manakah yang menurtjukkan hubungan yang betul antara halaju, v, kereta dengan masa, t, bagi pergerakan itu?


The graph shows a car moving along a straight line. How much time does it take for a car to travel 260 m?
Graf menunjukkan gerakan sebuah kereta diatas garisan lurus. Berapakah masa yang diambil oleh kereta untuk bergerak sejauh 260 m ?
5 saat
10 saat
15 saat
20 saat
Which graph shows a constant velocity?
Antara graf berikut, yang manakah menunjukkan halaju malar?


What is the similar graph with above graph?
Apakah graf yang sama dengan graf di atas?


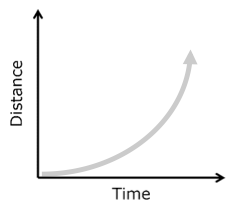
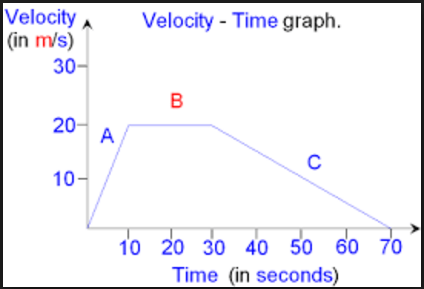
This is a velocity-time graph. What is the object doing in segment A?
Speeding up
Slowing down
Constant Velocity
Not moving
Which graph is a distance graph that shows the object is at rest?


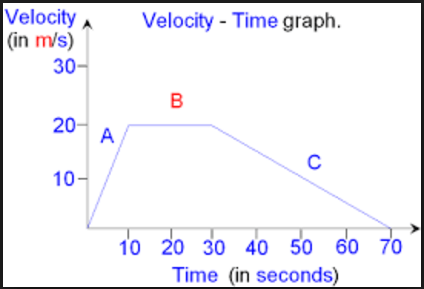


This graph show that
Constant acceleration
Constant velocity
Constant displacement
acceleration = 0

This graph show that
Constant acceleration
velocity increase
velocity decrease
constant deceleration

