
NEW
Font size
S
M
L
XL
 Worksheets
Analyzing Data
Total questions: 11
Worksheet time: 24mins
Name
Class
Date
1.

What is the median of the data?
a)
200
b)
100
c)
90
d)
140
2.

How many total people took the survey?
a)
50
b)
150
c)
100
d)
200
3.

Elliot says almost everyone arrived at the party after 10:00 P.M., but Nancy thinks most people came earlier. When did a majority of the people arrive?
a)
7:00-7:59 P.M.
b)
8:00–8:59 P.M.
c)
9:00–9:59 P.M.
d)
10:00–10:59 P.M.
4.

How many cities have temperatures between 70 degrees and 99 degrees?
a)
44
b)
34
c)
26
d)
62
5.
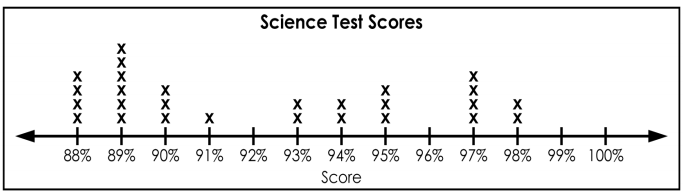
How many total students are in the science class?
a)
13
b)
6
c)
27
d)
25
6.

Type of Data arrangement
a)
Symmetrical
b)
Hairline
c)
Skewed Right
d)
Skewed Left
7.
Identify the outlier for the given data?
23, 34, 27, 7, 30, 26, 28, 31, 34
23, 34, 27, 7, 30, 26, 28, 31, 34
a)
7
b)
23
c)
31
d)
34
8.

What is the IQR of the box plot?
a)
3
b)
10
c)
15
d)
6
9.

Which scatter plot shows a linear relationship between x and y?
a)
Graph A
b)
Graph B
c)
Graph C
d)
Graph D
10.

What type of association does this graph have?
a)
positive
b)
negative
c)
none
d)
all of the above
11.
The height of students and their scores on a test.
a)
positive correlation
b)
negative correlation
c)
no correlation
Reset

