
 Worksheets
Visual Communication
Total questions: 20
Worksheet time: 13mins
Where should you look while presenting?
At the board - that's where the audience is looking
The entire audience
The people in the closest rows
What is Visual Communication?
(a)
Types of visual communication
Figure
Data
Illustration
Boxes
Table
factors influence the effectiveness visual design
Familiarity
Consistency
Contrast
Balance
Emphasis
5 visual communication tools that can be used for effective communication
Bar
Line
Pictorial
Pie chart
Hexagon chart
list the benefits of using visuals
(a)
What should you do while you do your presentation?
speak slowly
make eye-contact
read your slides
have a look outside
keep silent

It is a good idea to read to your audience when presenting.
False
True

Some students from Nevils Elementary want to make a bar graph showing how they get to school. 10 kids are car riders, 2 students are walkers, 8 kids ride the bus, and 2 kids ride their bikes. Help them create a bar graph representing this information.
What is a good title for this graph?
I Don't Like The Bus
How we Get to School
Nevils Elementary
Car Riders are Better
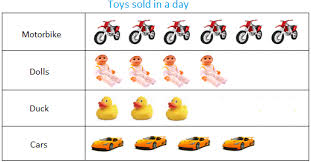
What type of graph is this?
bar chart
pictogram
tally chart
pie chart

There are 200 peaches. How many oranges are there?
230
260
130
360
Illustrates comparisons among individual items
bar
column
line
xy scatter
Compares values across categories
radar
combo
column
area
Displays trends over time
line
xy scatter
stock
surface

