
 Worksheets
P.S 1.7 Calculating Velocity from Slope
Total questions: 30
Worksheet time: 1hrs 18mins

During which time period is the object moving with the greatest velocity?
Between 5 and 10 seconds
Between 1 and 5 seconds
It is travelling the same velocity the whole time
Calculate the velocity of the object between 1 and 5 seconds. Include units.
10 m/s
2 m/s
5 m/s
1 m/s
Calculate the velocity of the object between 5 and 10 seconds. Include units.
20 m/s
10 m/s
5 m/s
2 m/s

Calculate the velocity of the object between 0 and 5 seconds. Include units.
20 m/s
10 m/s
5 m/s
2 m/s
Calculate the velocity of the object between 5 and 10 seconds. Include units.
0 m/s
1 m/s
2 m/s
3 m/s
Calculate the velocity of the object between 10 and 15 seconds. Include units.
40 m/s
20 m/s
10 m/s
5 m/s
Calculate the velocity of the object between 15 and 20 seconds. Include units. HINT: Do NOT estimate the final distance, use the exact number.
5 m/s
10 m/s
1 m/s
2 m/s

During which time period is the object moving with the greatest velocity?
Between 5 and 10 seconds
Between 0 and 5 seconds
Between 10 and 15 seconds
Between 15 and 20 seconds

Calculate the speed of the runner represented by the DOTTED line in Graph A.
2.5 yd/sec
5 yd/sec
2.5 sec
4 sec
Calculate the speed of the runner represented by the SOLID line in Graph A.
2.5 yd/sec
5 yd/sec
2.5 sec
4 sec
Calculate the speed of the runner represented by the SOLID line in Graph B.
2.5 yd/sec
5 yd/sec
30 yd
4 sec
Calculate the speed of the runner represented by the DOTTED line in Graph B.
2.5 yd/sec
5 yd/sec
7.5 yd/sec
4 sec
Calculate the speed of the runner represented by the DOTTED line in Graph C.
2.5 yd/sec
5 yd/sec
10 yd/sec
4 sec
Calculate the speed of the runner represented by the SOLID line in Graph C.
10 yd/sec
5 yd/sec
7.5 yd/sec
4 sec
Calculate the speed of the runner represented by the SOLID line in Graph D.
2.5 yd/sec
5 yd/sec
7.5 yd/sec
4 sec
Calculate the speed of the runner represented by the DOTTED line in Graph D.
2.5 yd/sec
5 yd/sec
7.5 yd/sec
4 sec
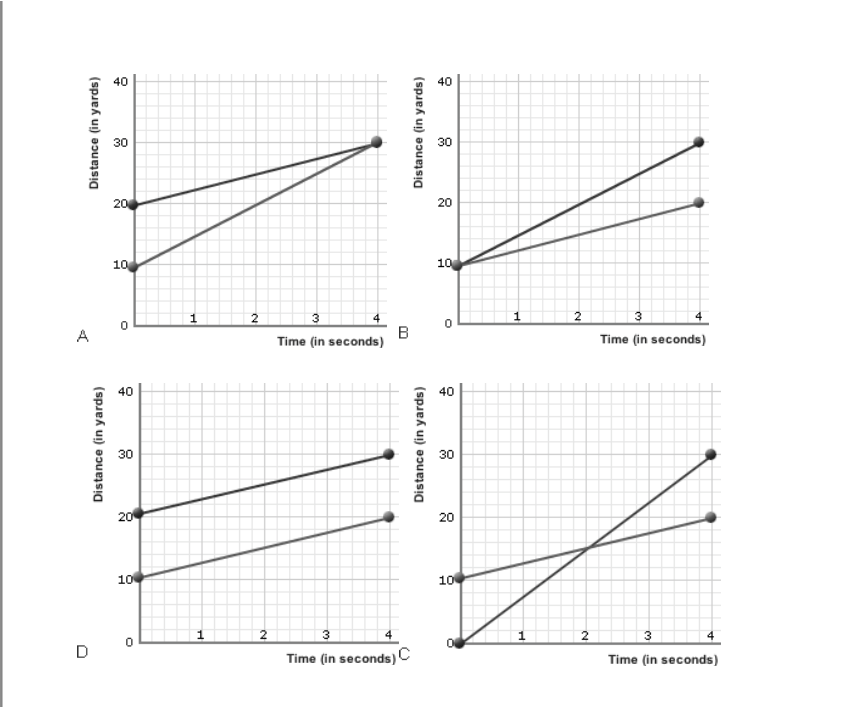
In which of the following graphs are both runners moving at the SAME speed?
Graph A
Graph B
Graph C
Graph D
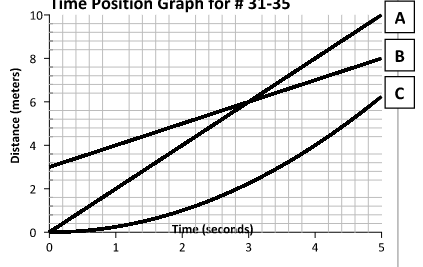
Which runner had the fastest speed?
A
B
C


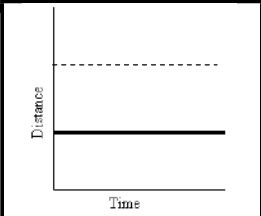
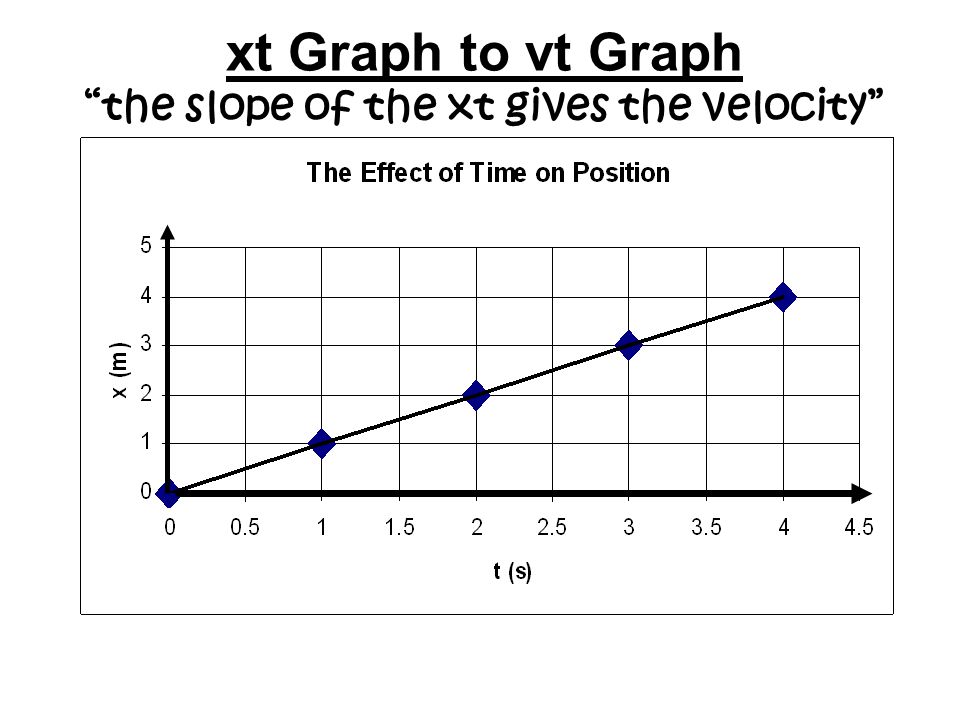
How fast is this object moving?
1 meter
1 meter /second
2 meters/second
4 seconds

At what time does this object have a negative velocity?
3 seconds
7 seconds
11 seconds
never
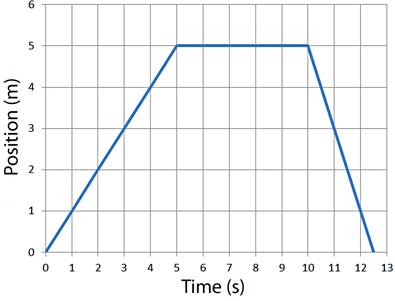
At 7 seconds, this object's velocity is:
positive
zero
negative
can't tell from the plot
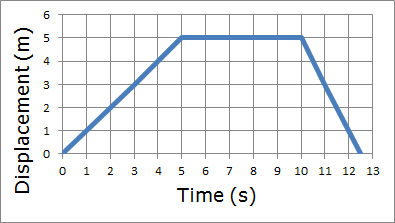

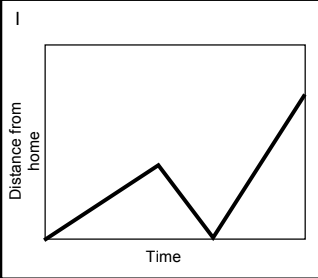
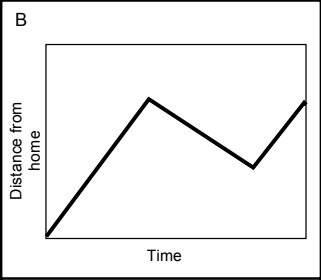
Susie went to the store, when she got there she realized that she forgot her wallet and returned home.
Which graph matches this motion?
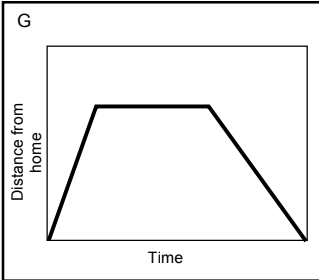
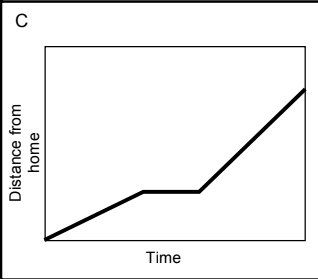
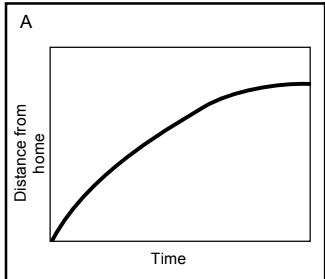
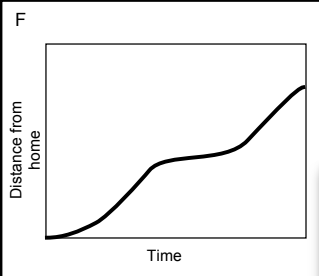
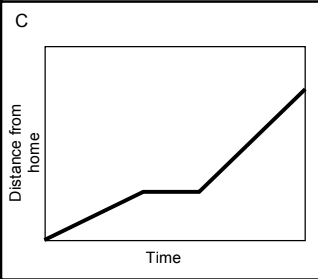
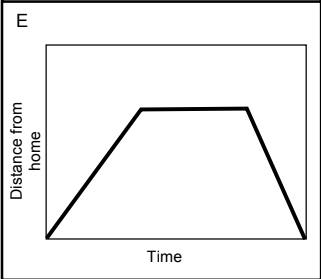
Deb walked to the ice cream shop. Sat and ate her ice cream and then went for a run.
Which graph matches this motion?
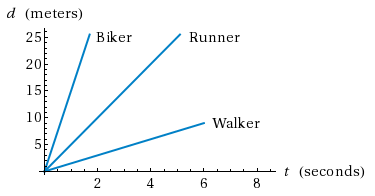
Which person moved the fastest in 3 seconds?
biker
runner
walker
they are all moving equally

