
 Worksheets
Kinematics Graphing and Math
Total questions: 30
Worksheet time: 5hrs 41mins
for 8 s until it finally lifts off the ground.
Determine the velocity at take-off.


Which graph(s) represents a constant velocity?
b
b and c
c
a and b
a

What is the rate of acceleration of the object between 0 and 4 seconds?
1 m/s
0 m/s2
-1 m/s2
1 m/s2

What is the velocity of the object between 4 and 5 seconds?
0 m/s
5 m/s
1 m/s
2 m/s

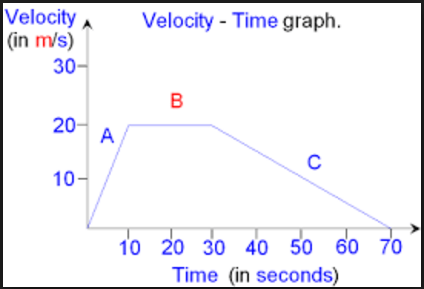
This is a velocity-time graph. What is the object doing in segment A?
Speeding up
Slowing down
Constant Velocity
Not moving

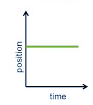
Describe the motion of the object in the graph
Moving with constant speed
Speeding up
Not moving


This graph represents slowing down in the positive direction then speeding up in the positive direction.


Calculate the displacement traveled in section B.
150 m
50 m
100 m
200 m
The area under a velocity-time graph represents __________.
displacement
velocity
acceleration
length x width
The slope of a velocity-time graph represents __________.
acceleration
displacement
speed
distance

Calculate the displacement traveled in section C.
200 m
100 m
50 m
400 m

How long would it take a car, starting from rest and accelerating uniformly in a straight line at 5 m/s2, to cover a distance of 200m
9.0s
10.5s
12.0s
15.5s
Starting from rest Martha accelerates her motor cycle forward at 5 m/s2 for ten seconds then accelerates backwards at 2 m/s2 for ten seconds. How fast is she going at the end of the 20 second time span described above?
40 m/s
30 m/s
50 m/s
0 m/s
Starting from rest Martha accelerates her motor cycle forward at 5 m/s2 for ten seconds then accelerates backwards at 2 m/s2 for ten seconds. How far did she go at the end of the 20 second time span described above?
650 m
400 m
200 m
250 m

