wayground logo

Free Printable Worksheets

NEW

Font size

S
M
L
XL
Worksheets

Physics Quiz#1 Teilhard

Total questions: 20

Worksheet time: 16mins

Name
Class
Date
1.

A tunnel has a length of 50 km. A car takes 20 min to travel between the two ends of the tunnel. What is the average speed of the car?

a)

2.5 km / h

b)

16.6 km / h

c)

150 km / h

d)

1000 km / h

2.

Which speed/ time graph applies to an object at rest?

a)

A

b)

B

c)

C

d)

D

3.
a)

10 m

b)

20 m

c)

100 m

d)

200 m

4.
a)

A

b)

B

c)

C

d)

D

5.
a)

A

b)

B

c)

C

d)

D

6.
Scott travels north 5 miles and then goes west 3 miles before coming straight back south 2 miles. What is his distance?
a)
10 miles
b)
7 miles
c)
8 miles
d)
6 miles
7.
 Ray runs 30 feet north, 30 feet west, and then 30 feet south. What is the displacement?
a)
30 feet west
b)
90 feet 
c)
30 feet south
d)
0 feet
8.
A quantity that has both magnitude and direction is called a scalar quantity.
a)
True
b)
False
9.
 Amy runs 2 miles south, then turns around and runs 3 miles north. What is displacement?
a)
5 miles
b)
1 mile 
c)
2 miles south
d)
1 mile north 
10.

What is the line on this graph showing?

a)

moving away from starting point at a constant speed

b)

moving back towards the starting point at a constant speed

c)

acceleration (getting faster)

d)

deceleration (getting slower)

11.

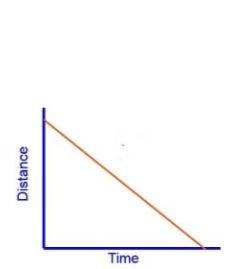
What is this line of this graph showing?

a)

moving away from starting point at a constant speed

b)

moving back towards the starting point at a constant speed

c)

acceleration (getting faster)

d)

deceleration (getting slower)

12.
Which graph is showing acceleration (getting faster)
a)
D
b)
E
c)
both D and E
d)
neither D or E
13.
Which graph is showing deceleration (getting slower)
a)
D
b)
E
c)
both D and E
d)
neither D or E
14.
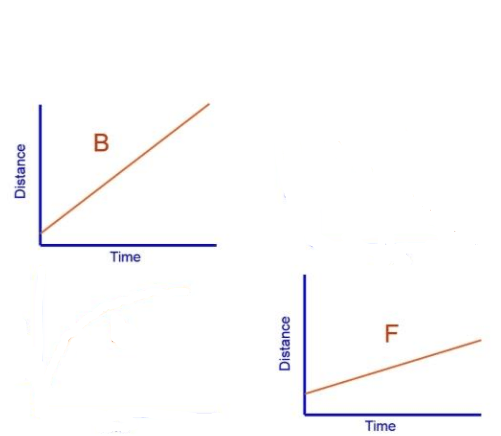
Which graph is showing a faster constant speed?
a)
B
b)
F
c)
They show the same speed
15.
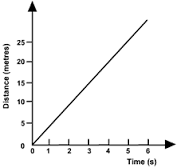
How long did it take this object to travel 10 m?
a)
0 s
b)
10 s
c)
15 s
d)
20 s
16.
At 60 seconds, how far had this object traveled? 
a)
0 m
b)
10 m
c)
20 m
d)
40 m
17.

What happened during E to F point?

a)

not moving

b)

increasing speed at a constant rate

c)

constant speed

d)

acceleration

18.

What is the formula for speed?

a)

speed = distance x time

b)

speed=distance / time

c)

speed = time / distance

d)

speed = distance + time

19.
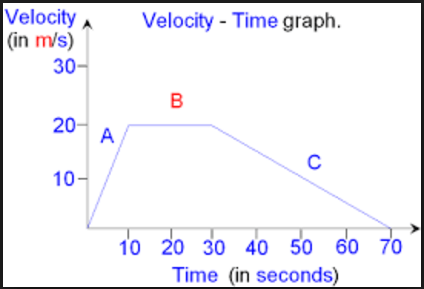
This is a velocity-time graph.  What is the object doing in segment C?
a)
Positive acceleration
b)
Negative acceleration
c)
Constant Velocity
d)
Not moving
20.
A car driving at 50 miles per hour drives for 2 hours. What distance did it cover?
a)
50 miles
b)
25 miles
c)
100 miles
d)
75 miles