
 Worksheets
Graphs and variables
Total questions: 25
Worksheet time: 17mins


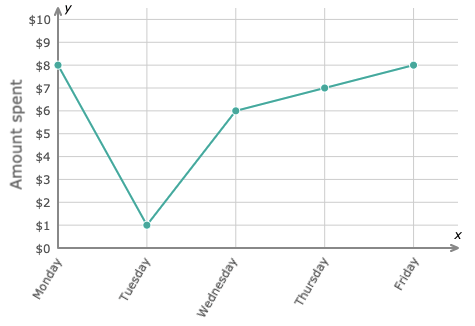
How much money was spent on Thursday?
1
6
7
8
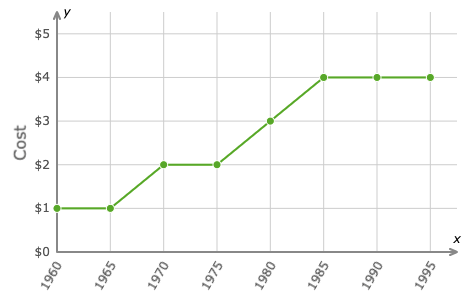
What year did a ticket cost $3.00?
1960
1970
1980
1990
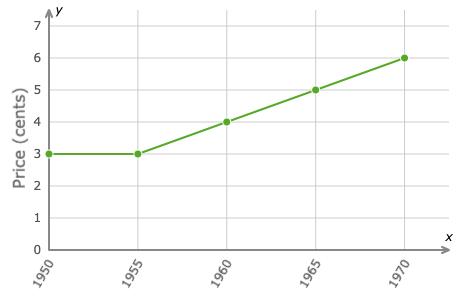
How much was a stamp in 1965?
3 cents
4 cents
5 cents
6 cents
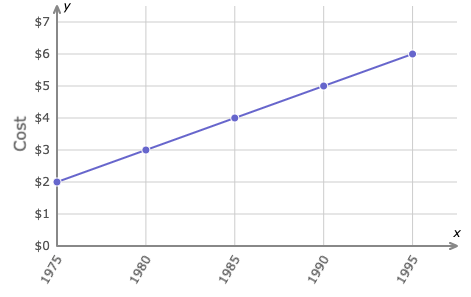
What year did a book cost $4.00?
1980
1985
1990
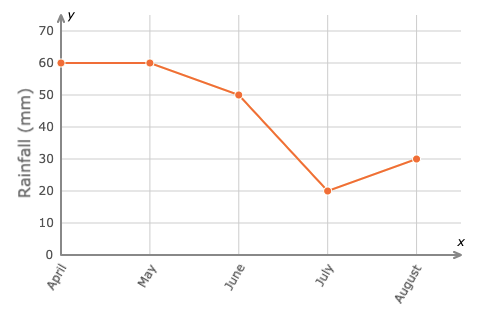
What is the rainfall total for May?
60 mm
50 mm
30 mm
20 mm
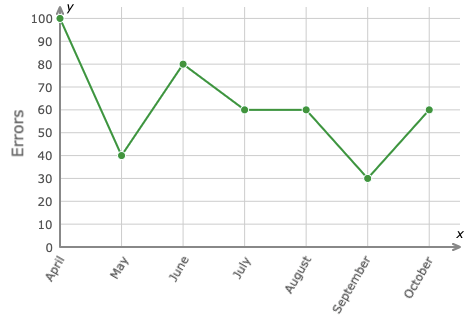
How many errors were made in June?
100
80
60
40
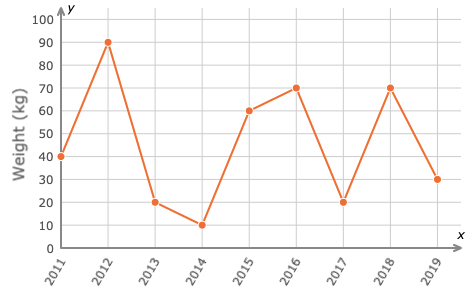
What was the average weight in 2018?
90 kg
70 kg
40 kg
30 kg
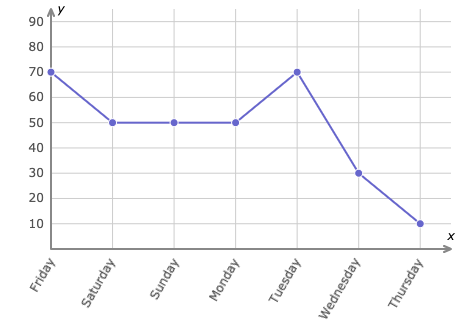
What day was the least amount of time spent on homework?
Friday
Sunday
Tuesday
Thursday
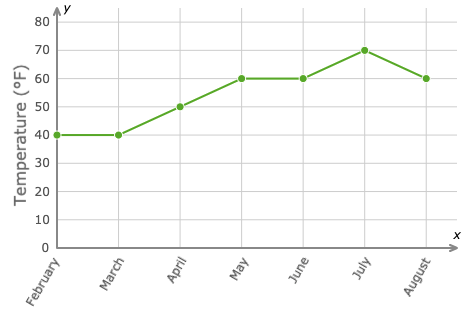
How much warmer was the temperature in April than March?
10 degrees
20 degrees
30 degrees
40 degrees
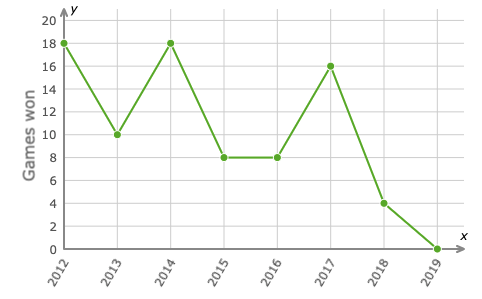
How many more games were won in 2014 than 2015?
4
8
10
12
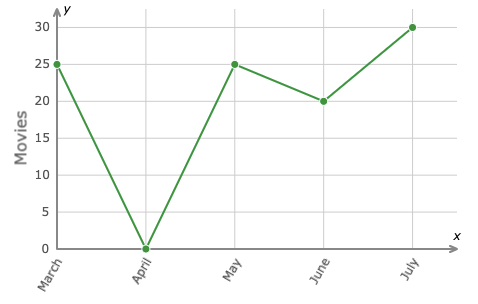
How many more movies were seen in March than April?
0
5
10
25
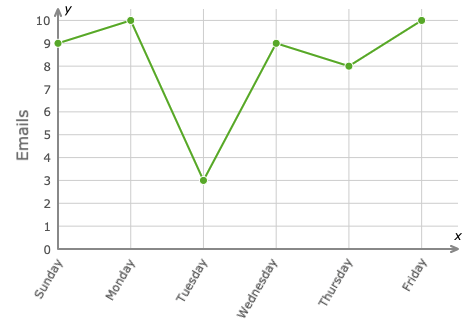
What days were 9 emails received? (Choose all that apply)
Sunday
Tuesday
Wednesday
Friday
In a line graph you will find the independent variable on .... axis and the dependent variable on .... axis
x , y
y, x
they can be switched
In a line graph ... (choose all that apply)
X is the horizontal axis
y is the horizontal axis
x is the vertical axis
y is the vertical axis

This graph shows the
effect of time on the distance moved
effect of distance on the time spent
that there is no co-relation between time and distance
there is no enough information

Relation between distance moved per time spent can be described as ...
force
energy
speed
motion

