
 Worksheets
PHY: Speed - Time & Velocity - Time Graphs
Total questions: 59
Worksheet time: 51mins
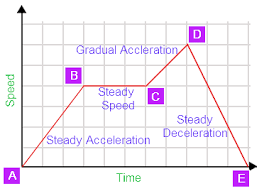
At what point is the speed the greatest?
C-D
B-C
A-B
D-E
A negative acceleration means that your object is _____.
doing nothing
moving in circles
speeding up
slowing down

What is happening during point A to B?
not moving
increasing speed at a constant rate
moving at a constant speed
moving at 10 m/s2 acceleration

What is happening during point C to D?
not moving
increasing speed at a constant rate
moving at a constant speed
moving at 0 m/s2 acceleration
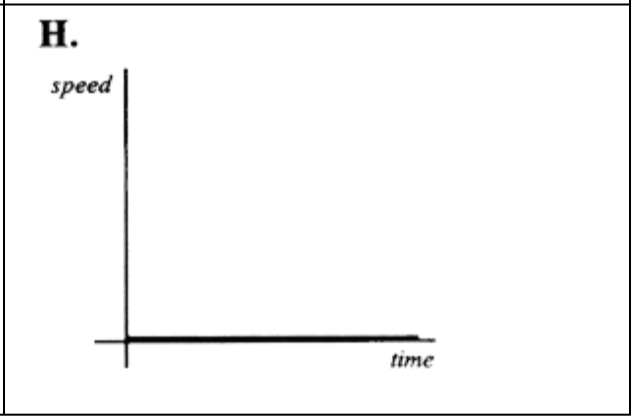
Match the graph to the description:
"The car is traveling at a constant speed."
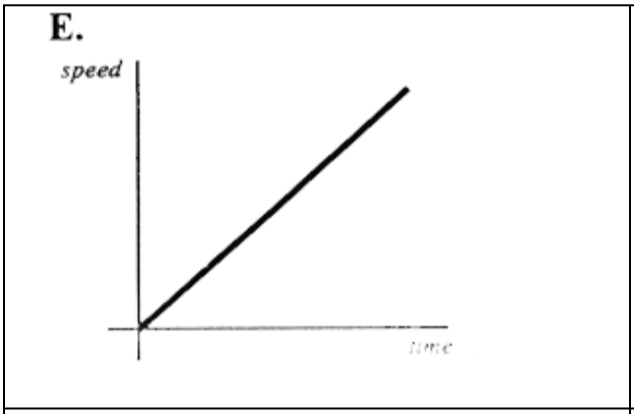
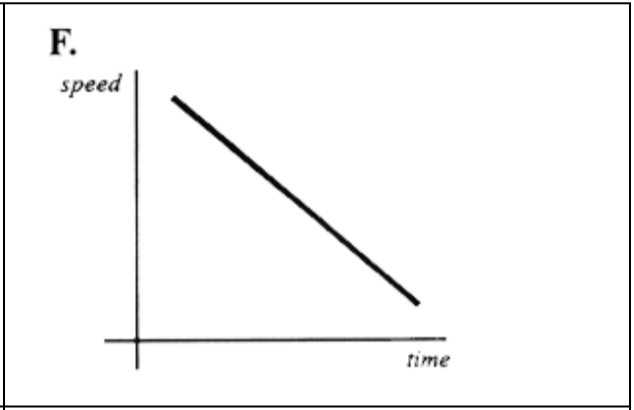
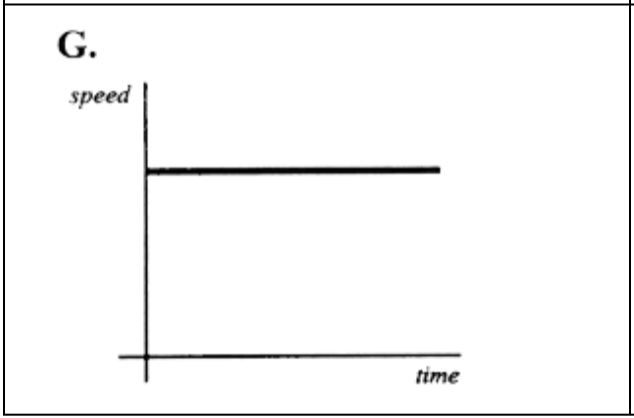
Match the graph to the description:
"The car is accelerating."
Match the graph to the description:
"The car is slowing down."
Match the graph to the description:
"The car is stationary."
Mark slams on the brakes after traveling 25 m/s. It takes him 3 seconds to come to a complete stop. What is his acceleration?
8.33 m/s2
-8.33 m/s2
75 m/s2
-75 m/s2

A car has an oil drip that drops every second. What is happening to the motion of the car shown above?
Car is moving with a constant velocity
Car is accelerating or speeding up
Car is decelerating or slowing down
Car is changing directions

What is happening to the car between 3-8 seconds?
The car is stopped
The car is traveling at a constant velocity of 0.5 m/s.
The car has an acceleration of 0.5 m/s2.
The car is going in the other direction.
What is happening to the car between 3-8 seconds?
The car is stopped
The car is traveling at a constant velocity of 0.5 m/s.
The car has an acceleration of 0.5 m/s2.
The car is going in the other direction.

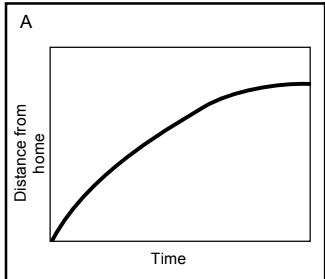




At what point is the speed the greatest?
C-D
B-C
A-B
D-E

What is this graph showing?
At rest
Acceleration
Constant speed of 1 m/s
Gradually speeding up
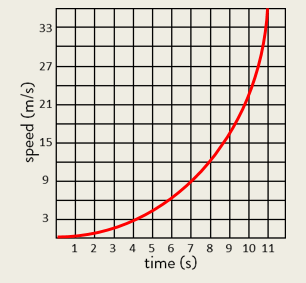
What is this graph showing?
Gradually slowing down
Gradually speeding up
Constant speed
Stopped

What is this graph showing?
Constant speed
Gradually speeding up
Gradually slowing down
At rest

What is this graph showing?
Fast constant speed
Slow constant speed
At rest
Accelerating

What is the graph showing?
Constant speed towards start
Constant speed away from start
Acceleration away from start
Acceleration towards start

Slows down toward start
Slows down away from start
Speeds up while toward start
Speeds up away from start

What is the graph showing?
Slows down toward start
Speeds up toward start
Slows down away from start
Speeds up away from start

How long is the train stopped for in total?
5 minutes
7.5 minutes
10 minutes
2.5 minutes
How fast is the train after 20 minutes?
0.5 km/min
0.2 km/min
5 km/min
5 km/h
What is happening during point C to D?
not moving
increasing speed at a constant rate
moving at a constant speed
moving at 0 m/s2 acceleration

How long did it take Charlie to finish the race?
A)14 meters
B)12 seconds
C)17 seconds
D)14 seconds
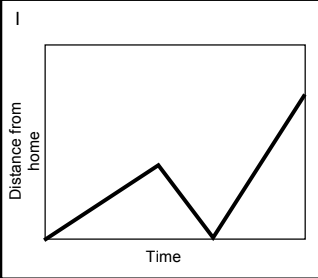
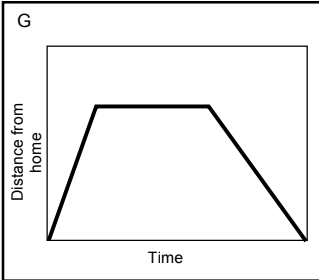
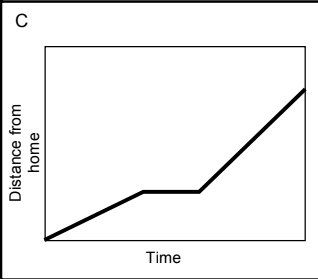
In which of the following graphs below are both runners moving at the same speed?


In which of the following graphs below did one runner overtake (run past) the other?


Paul swims at a speed of 5 km/h for 1.5 hours. Find the distance traveled in km.
7.5km
125km
120km
80km

How would you calculate the time it takes for a bird flying at a speed of 45 km/hr to travel a distance of 1,800 kilometers?
45 ÷ 1,800
45 × 1,800
1,800 ÷ 45
1,800 - 45

How would you calculate the distance traveled by a comet that is flying through the solar system at a speed of 50,000 km/hr for 4 hours?
50,000 ÷ 4
50,000 × 4
4 ÷ 50,000
4 - 50,000
What does the slope of the graph mean/represent?
Distance
Time
Speed
In which of the following situations would a car be slowing down while traveling backwards?
positive velocity and positive acceleration
positive velocity and negative acceleration
negative velocity and positive acceleration
negative velocity and negative acceleration

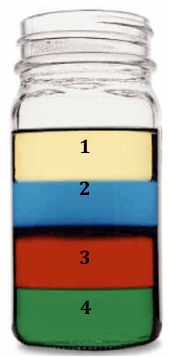
What is the formula for Mass?
Mass/Volume
Density x Volume
Mass/Density

