
NEW
Font size
 Worksheets
Graphs in Economic Analysis
Total questions: 45
Worksheet time: 1hrs 11mins

How many students take the bus to school?
35
20
10
15
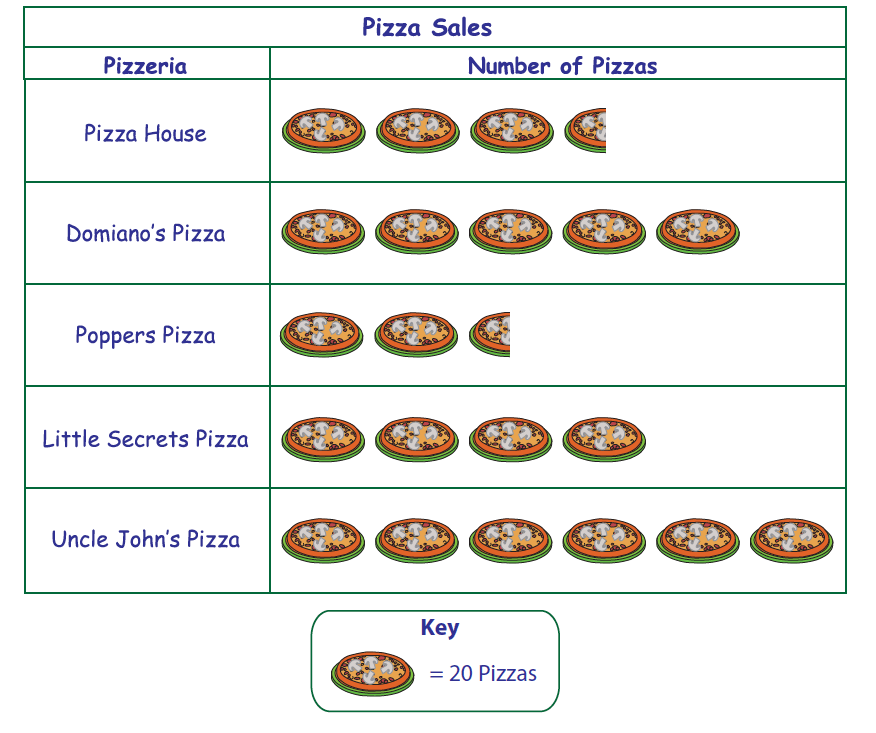
How many pizzas were sold by Poppers Pizza?
50
3
30
2 and a half

How many more students liked Chocolate than Mint Chocolate Chip and Strawberry combined?
8
6
14
12


Which month had the greatest number of books read?
November
December
January
February

Which month had the fewest books read?
January
February
March
April

Which month had the biggest difference between the high and low temperatures?
January
April
October
November
An outlier is..
a number that is repeated the most in the data.
a number that is the highest in the data.
a number that is the lowest in the data.
a number that is either much greater than or less than any other numbers in the data.
The vertical axis of a line graph is called the __________.
slope
line of best fit
x-axis
y-axis
A ____________ shows the overall trend of all the data taken in an experiment.
line of best fit
slope
position
direction
You can use a _______to show how the responding variable changes in response to the manipulated variable.
table
bar graph
line graph
circle graph
Which type of graph best represents data over a set period of time?
line
bar
table
circle
What is a dependent variable?
the variable the experimenter changes or manipulates.
the variable that changes because another variable changes
independent variables are only found on pie charts
a variable most often found on the x-axis
What is an independent variable?
the variable that changes because another variable changes
independent variables are only found on pie charts.
a variable most often found on the y-axis
the variable the experimenter changes or manipulates.
Which best describes a bar graph?
Any factor, trait, or condition that can exist in differing amounts or types
Useful for displaying data or information that changes continuously over time
Is a visual tool that uses bars to compare data among categories
Any display of information in tabular form, with rows and or columns named

32 people went to a ice hockey match. The pie chart shows the colours of their shirts. How many people wore black?
45
1
4

What is the ratio of tables to chairs?
3:1
3:4
360270

25% of a circle is equal to:
one-fifth
a quarter
a half
two fifth
A ________ is a type of graph that displays data in a circular graph.
Histogram
Pie Chart
Bar Diagram
Line Chart
In a Pie Chart, the pieces of the graph are _________ in each category.
not proportional to the fraction of the whole
equal to the fraction of the whole
proportional to the fraction of the whole
not equal to the fraction of the whole
The entire “pie” on a pie chart represents ________, while the pie “slices” represent ________.
portions of the whole; 100 percent of a whole
100 percent of a whole; 50 percent of a whole
100 percent of a whole; portions of the whole
portions of the whole; 50 percent of a whole
In a bar graph, the heights or lengths of the bars are ________ to the values that they represent.
proportional
equal
not proportional
never equal
A __________ is the simplest way to represent time series data.
pie chart
line graph
histogram
bar diagram
The relationship between two variables is called their _______.
regression
correlation
relation
relationship
A correlation could be ____, meaning both variables move in the same direction, or _____, meaning that when one variable's value increases, the other variables' values decrease.
negative; positive
constant; positive
negative; constant
positive; negative

What type of correlation does the graph show?
Positive Correlation
Negative Correlation
No Correlation

What type of correlation does the graph show?
Positive Correlation
Negative Correlation
No Correlation

What type of correlation does the graph show?
Positive Correlation
Negative Correlation
No Correlation
Which type of correlation most likely represents the relationship between number of hours studied for an exam and the grade on the exam?
Positive Correlation
Negative Correlation
No Correlation
Which graph depicts the strongest positive correlation?


A positive correlation is a relationship between two variables in which as one variable decreases the other decreases.
True
False
A negative correlation is a relationship between two variables such that as one variable increases the other decreases.
True
False


What does "m" stand for in the slope formula?
y axis
slope
y coordinate
x coordinate
Find the slope given the points (3,2) and (4,7).
4
5
-5
1/5
What is the slope formula?
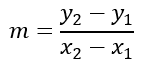
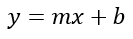
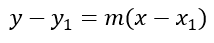
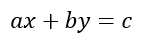
What is the slope of the line that passes through the points (2, 1) and (8, 9)?
4/3
-4/3
3/4
-3/4
In statistics, _________ occurs when a statistical model leaves out one or more relevant variables.
Selection bias
Recall bias
Omitted Variable bias
Observer bias
________ bias results in the model attributing the effect of the missing variables to those that were included.
Selection
Recall
Omitted Variable
Observer
If, instead of X causing a change in Y, it is really the other way around and Y is causing changes in X, then this is called ___________ causality.
Deterministic
final
reverse
Probabilistic

