wayground logo

Free Printable Worksheets

NEW

Font size

S
M
L
XL
Worksheets

Speed

Total questions: 40

Worksheet time: 1hrs 1mins

Name
Class
Date
1.

Paul swims at a speed of 5 km/h for 1.5 hours. Find the distance traveled in km.

a)

7.5km

b)

125km

c)

120km

d)

80km

2.
Which runner won the race?
a)
A
b)
B
c)
C
3.
Who won?
Hint: Greatest distance shortest time
a)

Albert  

b)

Bob

c)

Charlie

4.

Match the graph to the description:

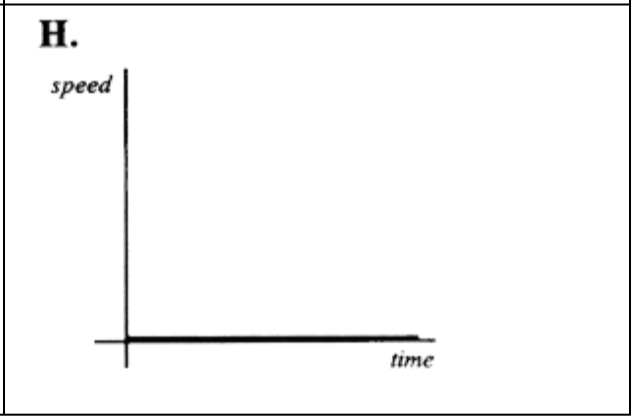
"The car is stopped."
a)
b)
c)
d)
5.

Match the graph to the description:

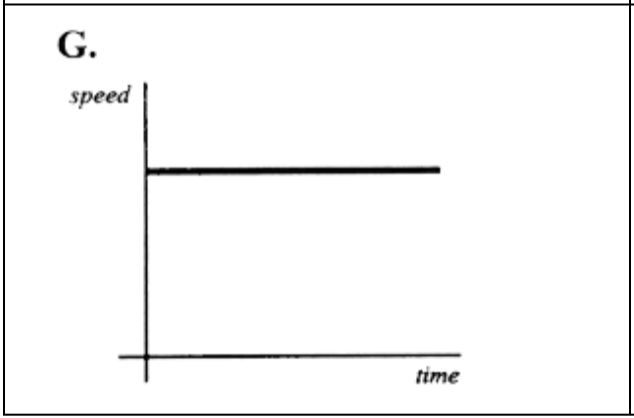
"The car is traveling at a constant speed."

a)
b)
c)
d)
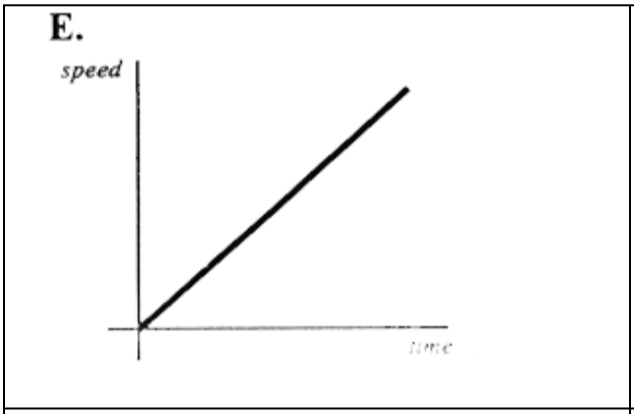
6.

Match the graph to the description:

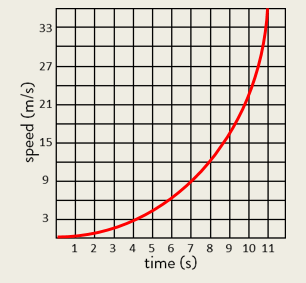
"The car is accelerating speeding up (positive acceleration)."

a)
b)
c)
d)
7.

Match the graph to the description:

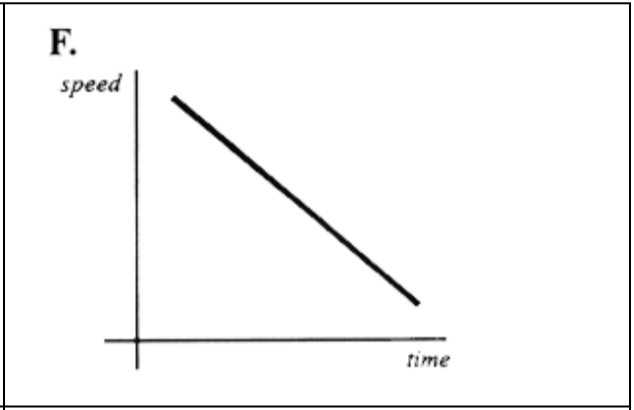
"The car is slowing down (negative acceleration)."
a)
b)
c)
d)
8.

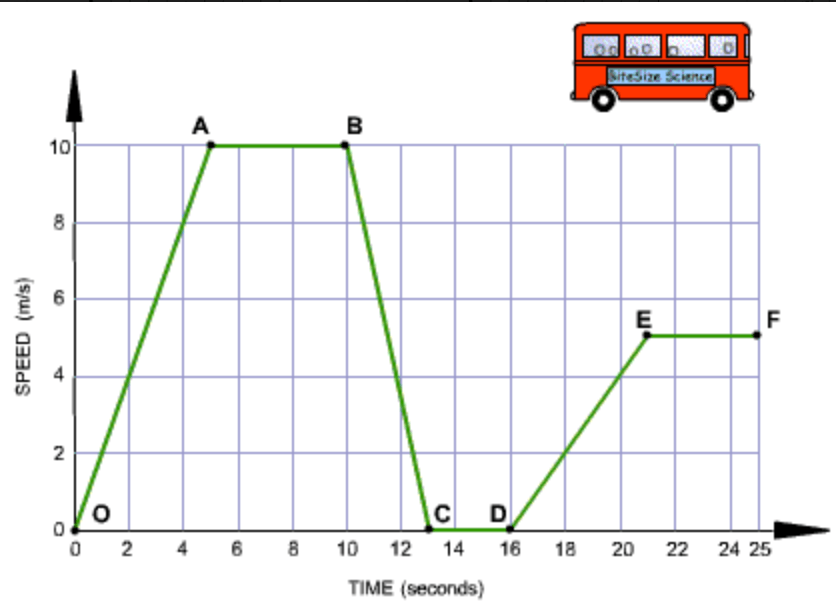
Segment O-A: The bus is _________________. It's speed changes from 0m/s to 10 m/s in 5 seconds.

a)

Speeding up

b)

Speeding down

c)

constant speed

d)

at rest

9.

Segment A-B: The bus is moving at a _________________ of 10 m/s for 5 seconds.

a)

accelerating

b)

decelerating

c)

constant speed

d)

at rest

10.

Segment B-C: The bus is _________________. It is slowing down from 10 m/s rest in 3 seconds.

a)

accelerating

b)

decelerating

c)

constant speed

d)

at rest

11.

Segment C-D: The bus is _________________. It has stopped.

a)

accelerating

b)

decelerating

c)

constant speed

d)

at rest

12.

Segment D-E: The bus is _________________. It is gradually increasing it's speed.

a)

accelerating

b)

decelerating

c)

constant speed

d)

at rest

13.

Segment E-F: The bus is moving at a _________________ of 5 m/s for 4 seconds.

a)

accelerating

b)

decelerating

c)

constant speed

d)

at rest

14.
What is happening in this graph from point A to B?
a)
The object is accelerating.
b)
The object is not moving.
c)
The object is decelerating.
d)
The object is moving at a constant speed.
15.
What is happening in the graph from point O to A?
a)
The object is moving SLOWLY
b)
The object is moving FAST
c)
The object is NOT moving
d)
The object is accelerating
16.
What is happening in this graph from point B to C?
a)
The object is going down a hill.
b)
The object is returning to its starting location.
c)
The object is slowing down.
d)
The object is staying still.
17.
What is happening from point D to E?
a)
The object is moving SLOWLY
b)
The object is moving FAST
c)
The object is decelerating
d)

The object is accelerating

18.
What is happening in this graph from point B to C?
a)
The object is going down a hill.
b)
The object is returning to its starting location.
c)
The object is slowing down.
d)
The object is staying still.
19.

How fast is the object traveling between points D and E?

a)
1 km/hr
b)
0 km/hr
c)
There is no way to tell from this graph
d)
0.9 km/hr
20.

Which line(s) represents a acceleration?

a)
A
b)
B and D
c)
C
d)
A, B, and D
21.
Which line(s) show a negative acceleration ?
a)
A
b)
B and C
c)
D
d)
A, B, and 
A, B, and D
22.
Which is correct?
a)
speed = distance x time
b)
speed = speed divided time
c)
speed = Distance divide time
d)
Speed = time x speed
23.
What two measurements are necessary for calculating speed?
a)
Mass and time
b)
Temperature and mass
c)
Mass and distance
d)
Distance and time
24.
What is speed?
a)
how far you go
b)
how much distance is covered over a period of time
c)
how fast you accelerate
d)
the change in the location of a object
25.

Changes in our speed are called _________.

a)
gravity
b)
changes
c)
acceleration
d)
displacement
26.
Which graph is would represent a decrease in speed?
a)
Graph A
b)
Graph B
c)
Graph C
d)
The object is not decreasing in speed in any of these graphs
27.

Which graph represents zero acceleration (constant speed)?

a)
A
b)
B
c)
C
d)
D
28.
a)
b)
c)
29.
Car W is traveling at 70 miles per hour.   Car X is traveling at 65 miles  per hour. Which statement is true about  the movement of the two cars?  
a)
Car W will travel farther  than Car X in the  same amount  of time.  
b)
Car X will  travel farther than Car W in  the same amount of  time.  
c)
Both Car X and  Car  W will travel the same distance in  the same amount of time. 
30.

What is the motion covered in section A of the graph

a)

Deceleration

b)

Stationary / no motion

c)

Acceleration

d)

Constant Speed

e)

Acceleration but not at a constant rate

31.

What is the motion covered in section D of the graph

a)

Deceleration

b)

Stationary / no motion

c)

Acceleration

d)

Constant Speed

e)

Acceleration but not at a constant rate

32.

What is the motion covered in section C of the graph

a)

Deceleration

b)

Stationary / no motion

c)

Acceleration

d)

Constant Velocity

e)

Acceleration but not at a constant rate

33.

What is the motion covered in section E of the graph

a)

Deceleration

b)

Stationary / no motion

c)

Acceleration

d)

Constant Velocity

e)

Acceleration but not at a constant rate

34.
What is this object doing?
a)
moving at a constant speed away from start and then stops
b)
increasing speed and then stops
c)
decreasing speed and then constant speed
d)
moving at a constant speed away from start and then constant speed
35.

Which car is going faster?

a)

car 1

b)

car 2

c)

both have same speed.

36.

What is this graph showing?

a)

At rest

b)

Acceleration

c)

Constant speed of 1 m/s

d)

Gradually speeding up

37.

What is this graph showing?

a)

Gradually slowing down

b)

Gradually speeding up

c)

Constant speed

d)

Stopped

38.

What is this graph showing?

a)

Constant speed

b)

Gradually speeding up

c)

Gradually slowing down

d)

At rest

39.

How Fast Do Airplanes Go?

a)

300 cm/s

b)

500 m/min

c)

900 km/h

d)

40 m/s

40.

What is this graph showing?

a)

Fast constant speed

b)

Slow constant speed

c)

At rest

d)

Accelerating