wayground logo

Free Printable Worksheets

Font size

S
M
L
XL
Worksheets

Test

Total questions: 200

Worksheet time: 5hrs 55mins

Name
Class
Date
1.
A PIE Chart is created using
a)
Cherries
b)
Apples
c)
Data
d)
Cars
2.
Which Continent is home to 36% of the wild cats?
a)
Asia
b)
Africa
c)
North America
d)
South America
3.
What percentage does a whole circle graph represent?
a)
360%
b)
90%
c)
50%
d)
100%
4.
According to this graph, what is the most popular flavor of Jolly Rancher?
a)
Cherry
b)
Grape 
c)
Blue Raspberry
d)
Watermelon
5.
Tina spends _____ of her day at work.
a)
33%
b)
29%
c)
9%
d)
6%
6.

32 people went to a ice hockey match. The pie chart shows the colours of their shirts. How many people wore black?

a)

45

b)


18\frac{1}{8}

c)

1

d)

4

7.

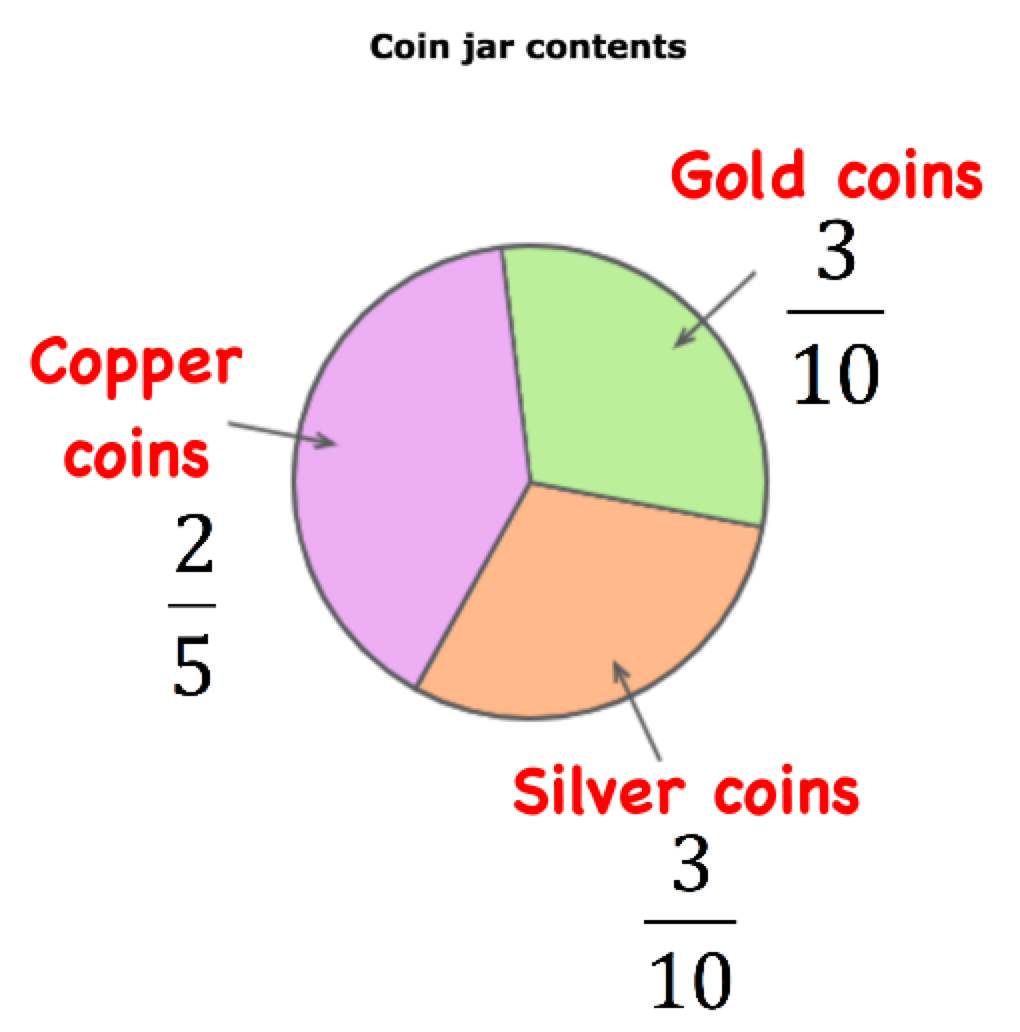
If there were 70 coins in the jar, how many of the coins are gold?

a)

2

b)

233

c)

21

d)

10

8.
200 people were surveyed about their favourite ice cream. How many chose Kesar Pista? 
a)
30 people
b)
60 people
c)
38 people
d)
None of these
9.

What percent of the annual sales were washers?

a)

20%

b)

30%

c)

25%

d)

0.20%

10.

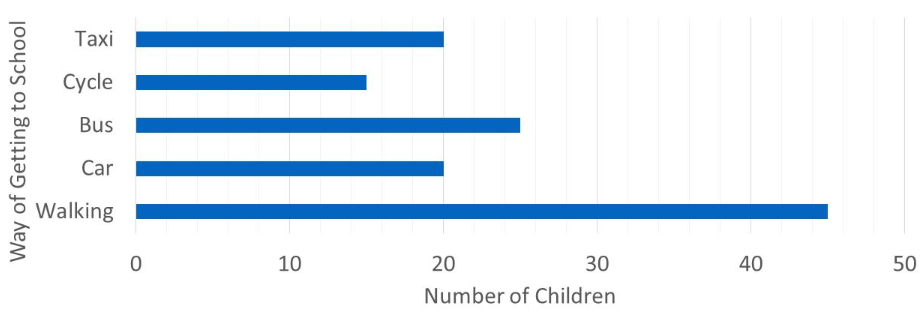
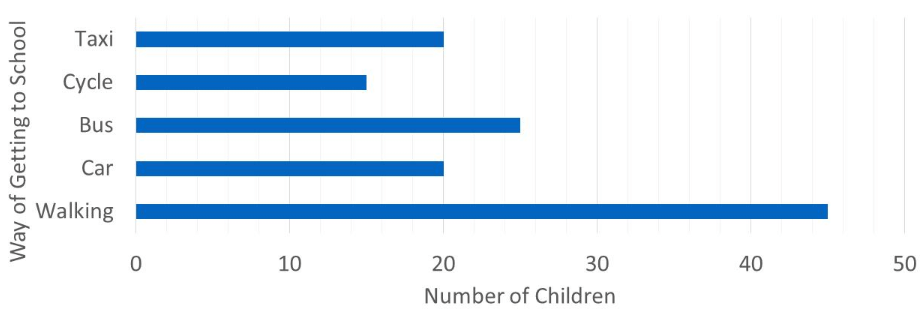
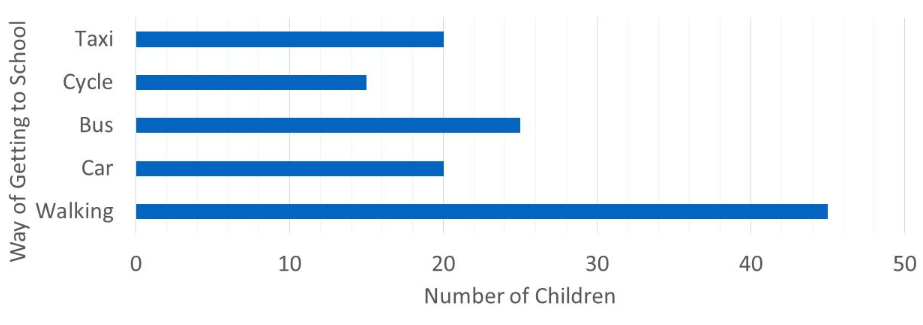
How many more children walk than take a taxi to school?

a)

45

b)

20

c)

25

d)

35

11.

In total, how many children take a taxi or cycle to school?

a)

5

b)

35

c)

20

d)

15

12.

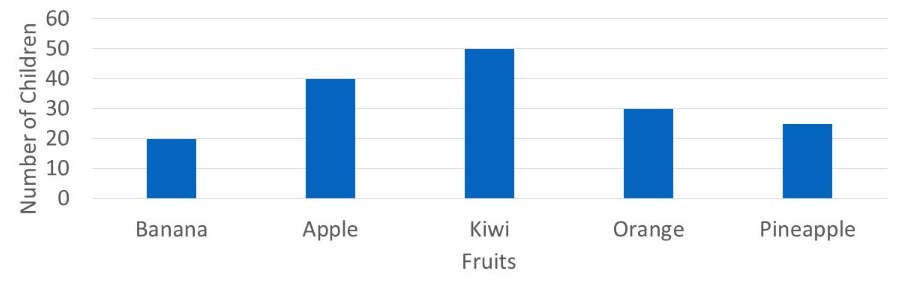
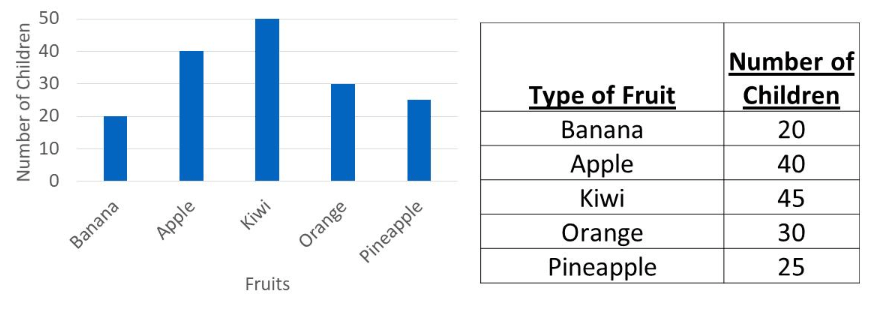
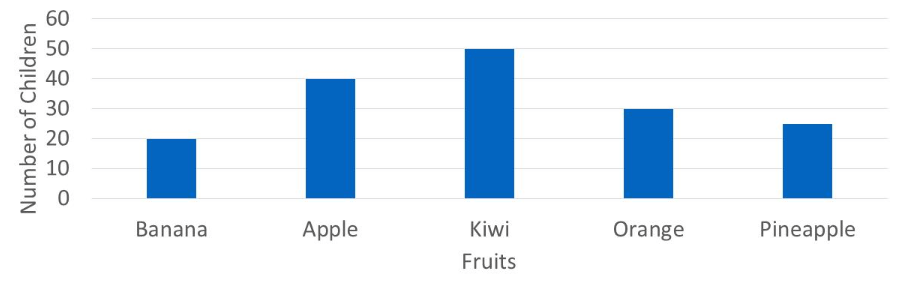
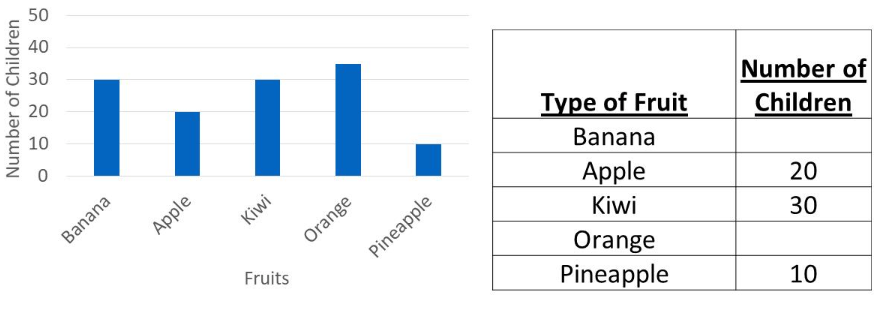
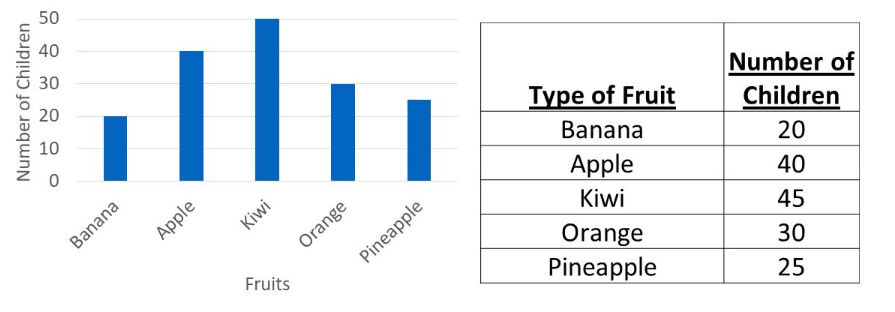
Which of the following statements is true?

a)

banana is the most popular fruit

b)

only pineapple is liked less than oranges

c)

kiwi is the most popular fruit

d)

apple is the third most popular fruit

13.

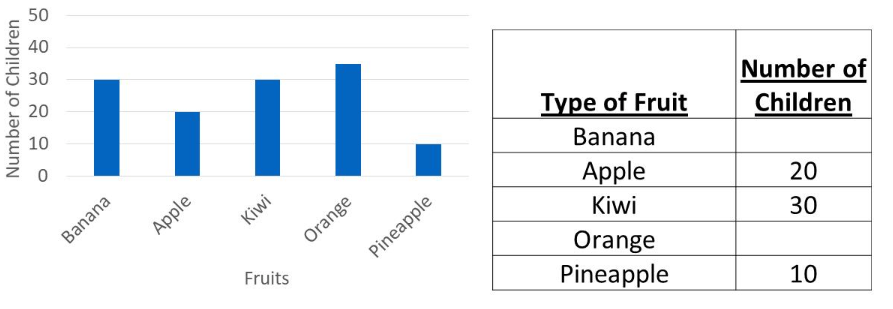
Which fruit's bar is displayed correctly?

a)

banana

b)

orange

c)

apple

d)

kiwi

14.

using the bar chart, what 2 numbers are missing from the table?

a)

30 and 35

b)

30 and 40

c)

pineapple, banana

d)

35 and 40

15.

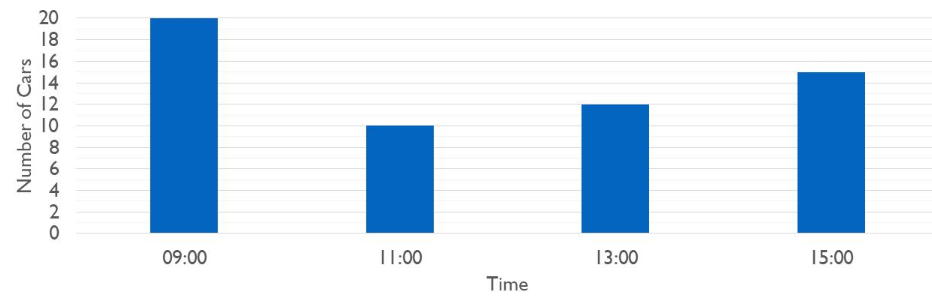
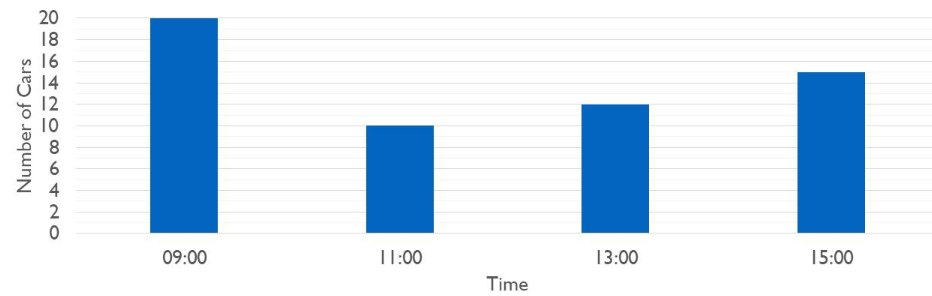
How many more cars pass at 15:00 than at 13:00?

a)

4

b)

10

c)

2

d)

3

16.

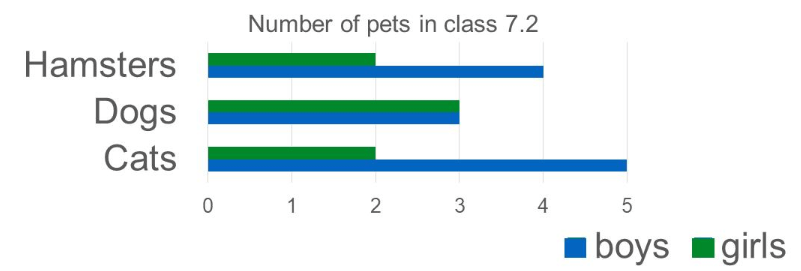
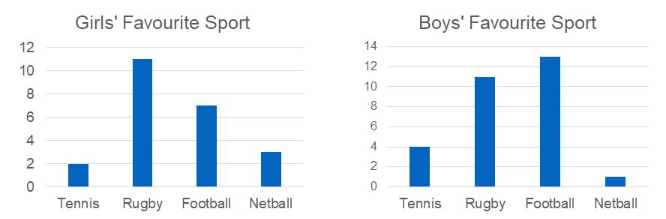
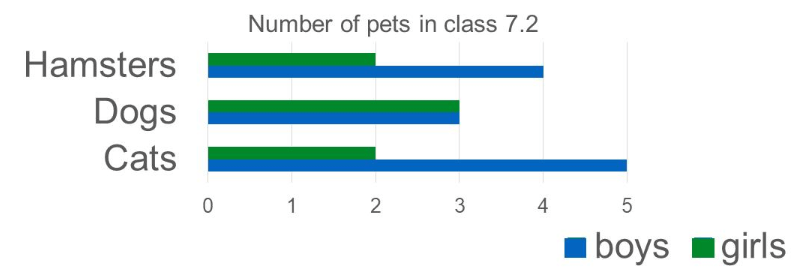
From the bar chart, how many pets do the girls in the class have?

a)

19

b)

12

c)

7

d)

you can't tell

17.

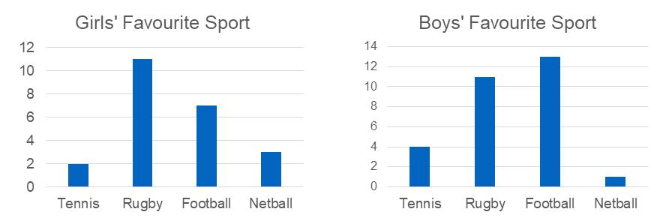
Which sport was picked by the same number of girls and boys?

a)

tennis

b)

football

c)

netball

d)

rugby

18.

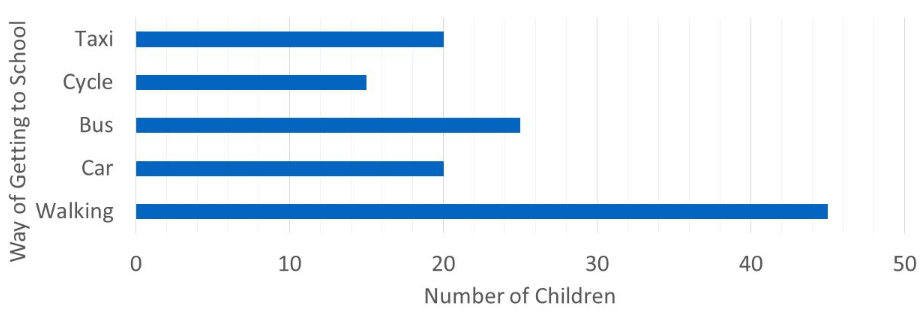
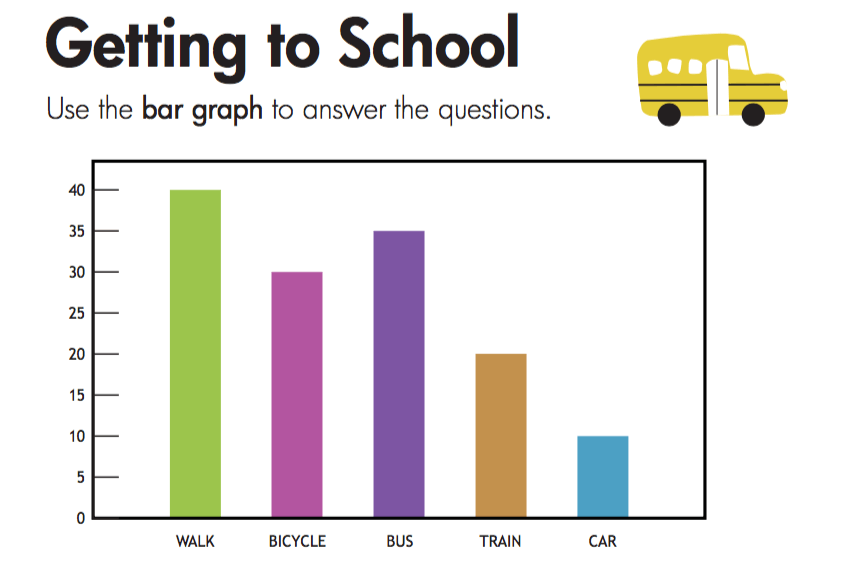
How many more children walk than take the bus to school?

a)

45

b)

20

c)

25

d)

10

19.

In total, how many children cycle or walk to school?

a)

15

b)

20

c)

45

d)

60

20.

Which of the following statements is true?

a)

pineapple is the most popular

b)

only apple is liked more than orange

c)

kiwi is the least popular fruit

d)

apple is the second most popular fruit
21.

Which fruit's bar is displayed incorrectly?

a)

banana

b)

pineapple

c)

apple

d)

kiwi

22.

Using the bar chart, what two numbers are missing from the table?

a)

20 and 30

b)

30 and 35

c)

orange, apple

d)

20 and 35

23.

How many more cars pass at 15:00 than at 11:00?

a)

10

b)

5

c)

4

d)

3

24.

From the bar chart, how many pets do the boys in the class have?

a)

19

b)

12

c)

7

d)

you cannot tell

25.

Which sport was picked by 2 more girls than boys?

a)

tennis

b)

football

c)

netball

d)

rugby

26.
What type of graph is this?
a)
bar graph
b)
pictograph
c)
tally chart
27.
Which pet got the most votes?
a)
cats
b)
dogs
c)
fish
28.
How many people like fish best?
a)
10
b)
4
c)
6
d)
5
29.
How many people like dogs best?
a)
10
b)
4
c)
6
d)
5
30.
Which fruit did most children choose?
a)
apple
b)
banana
c)
grapes
31.
How do you group tally marks together?
a)
by ones
b)
by twos
c)
by threes
d)
by fives
32.
How many fewer children chose science than math?
a)
2 children
b)
4 children
c)
5 children
33.
Use the picture to answer the following question.
Which subject did the most children choose?
a)
Math
b)
Reading
c)
Science
34.
How many more children chose math than reading?
a)
5 children
b)
2 children 
c)
4 children
35.
How many more children chose math than reading?
a)
5 children
b)
2 children 
c)
4 children
36.
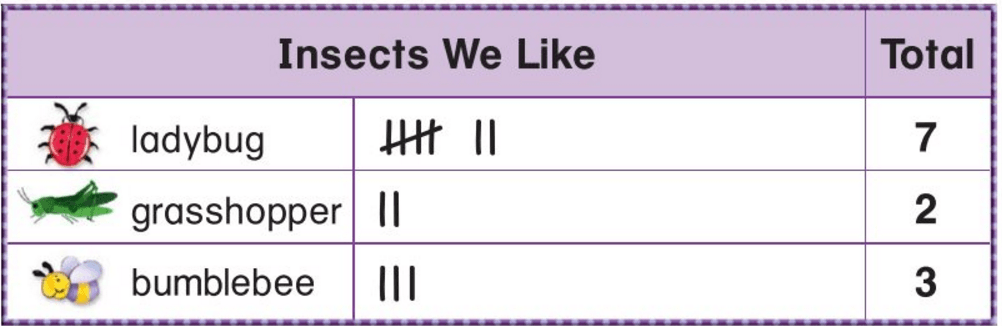
How many more people chose ladybug than bumblebee?
a)
3
b)
5
c)
4
37.
How many fewer people chose grasshopper than bumblebee?
a)
1
b)
2
c)
3
38.
Katie asked her friends their favorite food. Select the number of tally marks for Hot Dog.
a)
3
b)
4
c)
5
d)
6
39.
Choose the sentence that describes the data in the tally chart.
a)
Pizza had 10 votes.
b)
Pizza got the most votes
40.
How many total votes were collected?
a)
5
b)
10
c)
15
d)
20
41.
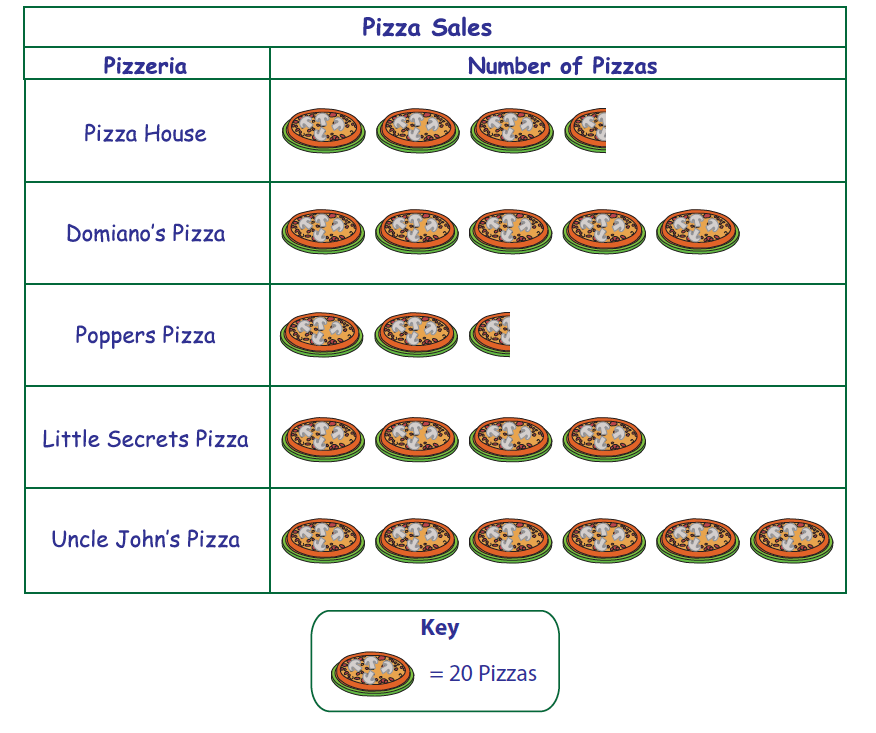
Which pizzeria has the second largest sales? 
a)
Pizza House
b)
Domiano's Pizza
c)
Little Secrets Pizza
d)
Uncle John's Pizza
42.

How many more pizzas were sold by Uncle John's Pizza than Little Secrets Pizza?

a)

40

b)

200

c)

210

d)

45

43.
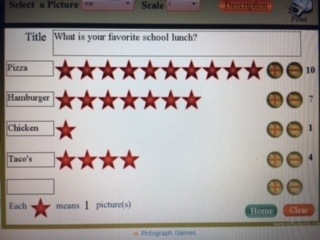
What was the favourite food?
a)
Chicken
b)
Pizza
c)
Taco's
d)
Hamburger
44.
How many more students liked pizza than those that liked chicken and taco's?
a)
10
b)
14
c)
4
d)
5
45.

How many students take the bus to school?

a)

35

b)

20

c)

10

d)

15

46.
How many mountain bikes were sold?
a)
22
b)
28
c)
16
d)
6
47.
How many people voted for red as their favourite colour?
a)
100
b)
2
c)
4
d)
9
48.
How many more people have purple for a favourite colour than red?
a)
3
b)
5
c)
7
d)
9
49.
Which of the following is not always a part of the graph?
a)
Horizontal and Vertical axes.
b)
Labels
c)
Average
d)
Title 
50.
Bars on a graph should be:  
a)
Equal width
b)
Varying heights
c)
Different colours 
d)
Both equal width and varying heights. 
51.
There are 200 vegetable plants in a garden.  How many of the vegetable plants are green beans?
a)
16
b)
24
c)
28
d)
32
52.
200 people were surveyed about their favourite ice cream. How many chose Kesar Pista? 
a)
30 people
b)
60 people
c)
38 people
d)
None of these
53.

600 people were surveyed. How many people rode the stationary bikes that day?

a)

150 people

b)

120 people

c)

90 people

d)

None of these

54.
According to this graph, what is the most popular flavor of Jolly Rancher?
a)
Cherry
b)
Grape 
c)
Blue Raspberry
d)
Watermelon
55.
What percentage does a whole circle graph represent?
a)
360%
b)
90%
c)
50%
d)
100%
56.

How many tally marks?

a)

4

b)

5

c)

6

57.

How many tally marks?

a)

20

b)

25

c)

15

58.

How many students ride their bicycle to school?

a)

20

b)

35

c)

30

59.

What is this type of graph called?

a)

Line plot

b)

Bar graph

c)

Pictograph

60.

Which subject do students like the least?

a)

math

b)

reading

c)

social studies

61.

We use a survey to collect ....

a)

information

b)

pictures

c)

bars

62.

When representing data using a bar chart :

a)

the width of each bar must be uniform

b)

there is no gap between the bars

c)

the bars need to be evenly spaced

63.

What is the total number of pupils in Primary 2 and Primary 5?

a)

495

b)

505

c)

515

d)

525

64.

Which Primary has 60 more pupils than Primary 2?

a)

Primary 3

b)

Primary 4

c)

Primary 5

d)

Primary 6

65.
Information in the form of numerical figures is called _____
a)
Range
b)
Frequency
c)
Values
d)
Data
66.
Data means information in the form of ________ figures.
a)
Raw
b)
Numerical
c)
Array
d)
None of the above
67.
 If each dot =1, how many students total took the quiz?
a)
25
b)
6
c)
20
68.
How many students spent 7 hours doing homework that week?
a)
1
b)
3
c)
5
d)
6
69.

The pie chart above shows the favorite fruits of a group of students. Which fruits is the most favorite fruit among students?

a)

Grapes

b)

Pineapple

c)

Banana

d)

Peach

e)

Orange

70.

Organizing the data in the tabular form which is represented in the form of lines is called ________.

a)

Bar Graph

b)

Tally Marks

c)

Pictograph

d)

Pie Chart

71.

The bars should be of equal _______.

a)

Length

b)

Width

c)

Area

d)

None of these

72.

Answer the following question by seeing the picture given above :-


How many children travel by bus ?

a)

12

b)

18

c)

21

d)

9

73.

What is the point called where both the axis of a bar graph meet ?

a)

centre point

b)

Origin

c)

Axis meeting point

d)

None of these

74.

The vertical line is called ______.

a)

Y-axis

b)

X-axis

c)

Both

d)

None

75.

The key is not much important in a pictograph.

a)

True

b)

False

76.

The lines for representing number '5' in tally marks is drawn as other lines.

a)

True

b)

False

77.

Observe the bar graph shown above and answer the following question :-


Which is the most liked colour and by how many children ?

a)

Red-4

b)

Yellow-7

c)

Red-10

d)

Yellow-9

78.

How many axis is/are there in a bar graph ?

a)

3

b)

5

c)

2

d)

1

79.

The value of both the axis is ______ at the origin.

a)

Zero

b)

One

c)

Two

d)

Three

80.
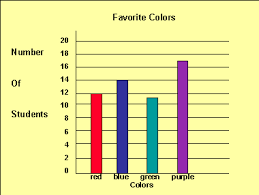
How many students have blue for a favorite color?
a)
11
b)
12
c)
14
d)
17
81.
On which day was the least amount of money made?
a)
Friday
b)
Monday
c)
Saturday
d)
Sunday
82.
What was the most a customer paid for a gallon of gas?
a)
$1.83
b)
$2.07
c)
$2.25
d)
$2.35
83.
How many people voted for popcorn and trail mix altogether?
a)
4
b)
9
c)
5
d)
17
84.
Which Continent is home to 36% of the wild cats?
a)
Asia
b)
Africa
c)
North America
d)
South America
85.

Which hero was least popular?

a)

Spiderman

b)

Batman

c)

The Hulk

d)

Superman

86.
How many total votes were collected?
a)
5
b)
10
c)
15
d)
20
87.

How many people liked mushroom and sausage?

a)

9

b)

45

c)

40

d)

90

88.
How much money was earned on Friday?
a)
$10.00
b)
$15.00
c)
$25.00
d)
$35.00
89.

Which one is a column chart?

a)

A

b)

B

c)

C

90.

25% of a circle is equal to:

a)

one-fifth

b)

a quarter

c)

a half

d)

two fifth

91.
A PIE Chart is created using
a)
Cherries
b)
Apples
c)
Data
d)
Cars
92.
Data for a PIE Chart comes from a
a)
Barn
b)
Table
c)
Farmer
d)
Shoe
93.
How many columns are used to make a PIE Chart?
a)
1
b)
2
c)
5
d)
10
94.
Which Continent is home to 36% of the wild cats?
a)
Asia
b)
Africa
c)
North America
d)
South America
95.
Which Continent is home to 13% of wild cats?
a)
Asia
b)
Africa
c)
North America
d)
South America
96.
Which Continent has the smallest % of wild cats?
a)
Asia
b)
Europe
c)
North America
d)
South America
97.
How many total votes were collected?
a)
5
b)
10
c)
15
d)
20
98.
Which pizzeria has the second largest sales? 
a)
Pizza House
b)
Domiano's Pizza
c)
Little Secrets Pizza
d)
Uncle John's Pizza
99.
What percentage does a whole circle graph represent?
a)
360%
b)
90%
c)
50%
d)
100%
100.

What angle would you use to represent 40 red cars out of 90 cars in total on a pie chart?

a)

40 degrees

b)

160 degrees

c)

4 degrees

d)

90 degrees

101.
Are these decimals in order from least to greatest?
5.04
5.069
5.4
5.64
a)
yes
b)
no
c)
maybe
d)
i don't know
102.
Which decimal is the smallest?
2.048
2.4
2.84
2.804
a)
2.048
b)
2.4
c)
2.84
d)
2.804
103.
Which decimal is the largest?
15.4
15.04
15.404
15.004
a)
15.4
b)
15.04
c)
15.404
d)
15.004
104.
Which decimal is closed to 3.45?
3.6
3.19
3.054
3.54
a)
3.6
b)
3.16
c)
3.054
d)
3.54
105.
Which decimal is the middle value?
5.64
5.4
5.064
a)
5.64
b)
5.4
c)
5.064
d)
all
106.
Which decimal is the smallest?
0.56
0.65
0.605
0.506
a)
0.56
b)
0.65
c)
0.605
d)
0.506
107.
Which decimal is the largest?
2.04
2.4
2.44
2.004
a)
2.04
b)
2.4
c)
2.44
d)
2.004
108.
What is 60% as a decimal?
a)
0.6
b)
0.06
c)
6.0
109.
If Kate eats 1/2 and Sue eats 1/4 of a bar of chocolate, what percentage has been eaten?
a)
50%
b)
25%
c)
75%
110.
1/5 as a percentage would be: 
a)
50%
b)
15%
c)
20%
d)
5%
111.
Write 5/100 as a decimal 
a)
0.05
b)
0.5
c)
0.51
d)
1.5
112.
Write 9/10 as a decimal
a)
9.10
b)
0.09
c)
0.9
d)
9
113.
Convert 2/5 from a fraction to a decimal
a)
0.02
b)
0.04
c)
0.2
d)
0.4
114.
Write 96 hundredths as a decimal 
a)
96.100
b)
0.96
c)
0.096
d)
96
115.
What is 42% expressed as a decimal?
a)
0.42
b)
4.2
c)
42
d)
0.042
116.
Express 19% as a decimal
a)
1.9
b)
19.0
c)
0.19
d)
190
117.
Emily bought the following amounts of fruit at a fruit stand:
0.75 pounds of grapes
0.5 pounds of bananas
1.25 pounds of apples

Which fruit weighs the least?
a)
Grapes
b)
Bananas
c)
Apples
d)
Fruit Salad
118.
Use the >,<, or=0.07____ 0.7
a)
<
b)
>
c)
=
119.
0.50 _____ 0.5
a)
<
b)
>
c)
=
120.
0.01 ____ 0.1
a)
<
b)
>
c)
=
121.
4.22 and 4.220
a)
<
b)
>
c)
=
122.
0.97 and 0.970
a)
<
b)
>
c)
=
123.
0.4 and 0.297
a)
<
b)
>
c)
=
124.
1.7 and 1.701
a)
<
b)
>
c)
=
125.
Which decimal comparison is correct?
a)
0.234 > 0.243
b)
0.361 < 0.613
c)
0.581 > 0.851
d)
0.483 < 0.438
126.
1.5 and 1.255
a)
<
b)
>
c)
=
127.
0.97 and 0.970
a)
<
b)
>
c)
=
128.
0.4 and 0.297
a)
<
b)
>
c)
=
129.
3.3 and 3.33
a)
<
b)
>
c)
=
130.
1.5 and 1.255
a)
<
b)
>
c)
=
131.
5.08 and 6.06
a)
<
b)
>
c)
=
132.
What decimal is between 0.8 and 0.9?
a)
0.9
b)
0.84
c)
0.8
d)
Both A and B
133.
Which describes the shaded portion of the figure?
a)
1/2 = 50%
b)
1/6 = 0.166....
c)
1/5 = 25%
d)
1/5 = 20%
134.
3/4 is equivalent to which percent?
a)
25%
b)
50%
c)
60%
d)
75%
135.
What is the percent of the shaded portion of the figure??
a)
20 %
b)
60%
c)
80%
d)
.60%
136.
Change this decimal to a percent.
0.528
a)
528%
b)
52.8%
c)
5.28%
d)
52%
137.

Order these numbers from greatest to least

0.25, 0.89, 0.56, 0.99

a)

0.99, 0.56, 0.89, 0.25

b)

0.25, 0.56, 0.89, 0.99

c)

0.99, 0.89, 0.56, 0.25

d)

0.89, 0.56, 0.25, 0.99

138.
Are these decimals in order from greatest to least?
8.47
8.047
8.7
8.074
a)
yes
b)
no
139.
Are these decimals in order from greatest to least?
0.1
1.25
3.25
0.001
a)
yes
b)
no
140.
Are these decimals in order from least to greatest?
5.04
5.069
5.4
5.64
a)
yes
b)
no
141.
Order the decimals from least to greatest.
0.138, 10.4, 0.316
a)
10.4, 0.136, 0.318 
b)
10.4, 0.138, 0.316
c)
0.138, 10.4, 0.316
d)
0.138, 0.316, 10.4
142.

Order from least to greatest. 1.25 1.52 1.02 1.50

a)

1.25 1.52 1.02 1.50

b)

1.52 1.02 1.50 1.25

c)

1.02 1.50 1.25 1.52

d)

1.02 1.25 1.50 1.52

143.
Order from least to greatest. 45.0  40.5  40.09  49.5
a)
40.5  40.09  45.0  49.5
b)
40.09  40.5  45.0  49.5
c)
40.5  40.09  45.0  49.5
d)
45.0  40.5  40.09  49.5
144.
Two students were given the numbers:
              0.23, 0.9, 0.019
John put his numbers in order like this:
0.9, 0.23, 0.019
Jessica put her numbers in order like this:
0.019, 0.23, 0.9
Who put their numbers in order from least to greatest? 
a)
Jessica
b)
John
c)
My mama
d)
My daddy
145.
Order the decimals from least to greatest.  0.38, 0.4, 0.36
a)
0.38, 0.4, 0.36
b)
0.4, 0.36, 0.38
c)
0.36, 0.4, 0.48
d)
0.36, 0.38, 0.4
146.
Write 2% as a decimal.
a)
0.20
b)
0.02
c)
200.0
d)
2.0
147.
Look at the shaded model.  Which number sentence is true?
a)
1/8<3/8
b)
3/8<1/8
c)
7/8<5/8
d)
5/8>1/8
148.
Look at the model.  Which number sentence is true?
a)
>
b)
<
c)
=
149.
Look at the number line model.  Which number sentence is true?
a)
3/4>3/5
b)
3/5>3/4
150.
Look at the shaded model.  Which number sentence is true?
a)
1/3>7/12
b)
2/3>7/12
c)
2/3<7/12
d)
1/3<7/12
151.
Look at the shaded model.  Which number sentence is true?
a)
4/7<1/3
b)
7/10<2/6
c)
2/6=1/3
d)
4/7>7/10
152.
All of the following are equivalent fractions except ...
a)
1/3
b)
2/6
c)
2/12
d)
3/9
153.
Which of these show equivalent fractions?
a)
A
b)
B
c)
C
154.
Which fraction would make this statement true?
2 / 3  < _____
a)
2/3
b)
1/3
c)
1/2
d)
3/3
155.
Hunter finished 3/8 of his homework before supper.  Macy finished 2/3 of her homework before supper.  Which statement correctly compares the fractions?
a)
3/8 < 2/3
b)
3/8 > 2/3
c)
3/8 =  2/3
d)
2/3 < 3/8
156.
Mr. Mustard has a recipe for baked pineapple that uses 3/4 cup of sugar.  Which fraction is greater than to 3/4?
a)
1/2
b)
2/8
c)
7/8
d)
6/12
157.
Mrs. Carrier wrote the following list of fractions on the board. 
1/6, 1/3, 1/4, 1/8
Which has the greatest value?
a)
1/6
b)
1/3
c)
1/4
d)
1/8
158.
7/12
a)
more than 1/2
b)
less than 1/2 
c)
more than 1
159.
Look at the shaded model.  Which number sentence is true?
a)
3/8>5/8
b)
4/8<3/8
c)
3/8<4/8
d)
3/8<5/8
160.
change .3 to a percent
a)
3%
b)
30%
c)
300%
d)
.30%
161.
Change .04 to a percent
a)
40%
b)
400%
c)
4%
d)
.4%
162.
Change 247% to a decimal
a)
24.7
b)
2.47
c)
.247
d)
.0247
163.
change .32% to a decimal
a)
3.2
b)
.32
c)
.032
d)
.0032
164.
change 25% to a decimal
a)
.25
b)
.2
c)
2.5
d)
.025
165.
Order these numbers from least to greatest
2.3, 1.7, 3.9, 4.5
a)
4.5, 3.9, 2.3, 1.7
b)
39, 45, 17, 23
c)
1.7, 2.3, 3.9, 4.5
d)
3.9, 4.5, 1.7, 2.3
166.
44% can be written as the following decimal and fraction...
a)
0.44 and 44/10 
b)
0.44 and 44/100
c)
0.4 and 44/100
d)
0.4 and 44/10
167.
The fraction 4/10 can be written as the following decimal and percent...
a)
0.4, 40%
b)
0.4, 4%
c)
0.4, 0.4%
d)
0.04, 4%
168.
8% can be written as the following decimal and fraction...
a)
0.8, 80/100
b)
0.8, 8/10
c)
0.08, 8/100
169.
0.01 can be written as the following percent and fraction...
a)
1%, 1/100
b)
1%, 1/10
c)
0.1%, 1/10
d)
0.1%, 1/100
170.
15% can be written as the following decimal and fraction...
a)
0.15, 150/100
b)
0.15, 15/100
c)
0.15, 15/10
d)
1.5, 15/100
171.
If you receive a 45/50 on a test , what is your percentage?
a)
45%
b)
80%
c)
90%
d)
70%
172.
Jade earned a 7% commission on a $500 sale of a boat.  How much was her commission?
a)
$535
b)
$35
c)
$500
d)
$50
173.

Express 0.2 as a percentage

a)

20%

b)

2%

c)

0.2%

d)

200%

174.

Express 30% as a fraction

a)

310\frac{3}{10}

b)

35\frac{3}{5}

c)

3010\frac{30}{10}

d)

3100\frac{3}{100}

175.

Express 25% as a fraction

a)

14\frac{1}{4}

b)

251000\frac{25}{1000}

c)

18\frac{1}{8}

d)

12\frac{1}{2}

176.

Express 20% as a fraction

a)

110\frac{1}{10}

b)

15\frac{1}{5}

c)

25\frac{2}{5}

d)

150\frac{1}{50}

177.

Express 10% as a fraction

a)

1100\frac{1}{100}

b)

110\frac{1}{10}

c)

101000\frac{10}{1000}

d)

210\frac{2}{10}

178.

Express  45\frac{4}{5}  as a percentage

a)

20%

b)

80%

c)

40%

d)

45%

179.

Express 90% as a decimal

a)

0.9

b)

9.0

c)

0.09

d)

90.0

180.

Express 75% as a fraction

a)

7510\frac{75}{10}

b)

57\frac{5}{7}

c)

14\frac{1}{4}

d)

34\frac{3}{4}

181.

Express 80% as a decimal

a)

0.8

b)

0.08

c)

8.0

d)

0.008

182.

Express  18\frac{1}{8}  as a decimal

a)

0.125

b)

0.215

c)

0.25

d)

0.375

183.

Express 60% as a fraction

a)

6100\frac{6}{100}

b)

35\frac{3}{5}

c)

350\frac{3}{50}

d)

310\frac{3}{10}

184.

Express 25\frac{2}{5} as a percentage

a)

25%

b)

40%

c)

20%

d)

4%

185.

Which of these is not equivalent to the others?

a)

25%

b)

14\frac{1}{4}

c)

0.25

d)

38\frac{3}{8}

186.

Which of these is not equivalent to the others?

a)

1.25%1.25\%

b)

18\frac{1}{8}

c)

0.1250.125

d)

216\frac{2}{16}

187.

Which of these is not equivalent to the others?

a)

13\frac{1}{3}

b)

3313%33\frac{1}{3}\%

c)

33.3%33.3\%

d)

0.333...0.333...

188.

Which of these is the largest?

a)

13\frac{1}{3}

b)

38\frac{3}{8}

c)

0.350.35

d)

30%30\%

189.

Choose the bigger decimal

a)

0.3

b)

0.03

190.

Which is greater?

a)

14 hundredths

b)

2 tenths

191.

Which is greater?

a)

0.8

b)

5 tenths and 4 hundredths

192.

Which is greater?

a)

39 Hundredths

b)

0.4

193.

Which is greater?

a)

0.5

b)

0.43

194.

Which is greater?

a)

0.58

b)

7 tenths

195.

Which is greater?

a)

3 tenths and 15 hundredths

b)

0.37

196.

Which is larger?

a)

0.8

b)

6 tenths and 24 hundredths

197.

Which is greater?

a)

0.61

b)

4 tenths and 20 hundredths

198.

Express 30% as a fraction

a)

310\frac{3}{10}

b)

35\frac{3}{5}

c)

3010\frac{30}{10}

d)

3100\frac{3}{100}

199.

Which of these is the largest?

a)

13\frac{1}{3}

b)

38\frac{3}{8}

c)

0.350.35

d)

30%30\%

200.

Order these numbers from greatest to least

0.25, 0.89, 0.56, 0.99

a)

0.99, 0.56, 0.89, 0.25

b)

0.25, 0.56, 0.89, 0.99

c)

0.99, 0.89, 0.56, 0.25

d)

0.89, 0.56, 0.25, 0.99