wayground logo

Free Printable Worksheets

NEW

Font size

S
M
L
XL
Worksheets

Unit 3 Review

Total questions: 37

Worksheet time: 54mins

Name
Class
Date
1.

Choose the best answer that describes the image.

a)

Function

b)

Not a Function

2.

Choose the best answer that describes the image.

a)

Function

b)

Not a Function

3.

Choose the best answer that describes the image.

a)

Function

b)

Not a function

4.

Choose the best answer that describes the image.

a)

Function

b)

Not a function

5.

Choose the best answer that describes the image.

a)

Function

b)

Not a Function

6.

Choose the best answer that describes the image.

a)

Function

b)

Not a function

7.
Is this graph a function or not a function? 
a)
Function
b)
Not a Function
8.
A relation is a function when.......
a)
the input is only with one output.
b)
the input is repeating with different output.
c)
the output is repeating.
d)
the input is repeating.
9.
Which of these tables represent a function?
a)
A
b)
B
c)
C
d)
D
10.

Choose the best answer that describes the image.

a)

Function

b)

Not a function

11.

Choose the best answer that describes the image.

a)

Function

b)

Not a function

12.
Is the function Linear or Nonlinear?
a)
Linear
b)
Nonlinear
13.
Is the function Linear or Nonlinear?
a)
Linear
b)
Nonlinear
14.
Is function represented by the table linear or nonlinear?
a)
linear
b)
nonlinear
15.
Is this function linear or nonlinear?
a)
Linear
b)
Nonlinear
16.
Is the function linear or nonlinear?
a)
Linear Function
b)
Nonlinear Function
17.
Is the graph pictured a linear or nonlinear function?
a)
Linear
b)
Nonlinear
18.
Is this function linear or nonlinear?
a)
Linear
b)
Nonlinear
19.
Is this function linear or nonlinear?
a)
Linear
b)
Nonlinear
20.
Write the equation for the line in slope-intercept form.
a)
y= -1x+3
b)
y= 4x+3
c)
y=1/4x+3
d)
y= -4x+3
21.
Write the equation of the line.
a)
y = -1/3x - 2
b)
y = 1/3x - 2
c)
y = 3x - 2
d)
y = -3x - 2
22.
Write the equation of the line.
a)
y = -2/3x + 4
b)
y = 2/3x + 4
c)
y = 3/2x + 4
d)
y = -3/2x + 4
23.
For babysitting, Nicole charges a flat fee of $3, plus $5 per hour. Write an equation for the cost, C, after h hours of babysitting. 
a)
C = 5h + 3
b)
C = 3h + 5
c)
H = 5c + 3
d)
H = 3c + 5
24.

What is the equation of a line with a slope of 2 and a y-intercept of -5?

a)

y = 5x - 2

b)

y = 2x - 5

c)

y = -2x - 5

d)

y = 2x + 5

25.

What is the equation of a line when m = -7 and b = -8?

a)

y = -7x + 8

b)

y = -7x - 8

c)

y = 7x - 8

d)

y = 7x + 8

26.
Find the slope from the table.
a)
-4
b)
1
c)
4
d)
-2
27.

What is the equation of the line represented by the table?

a)

y = -1/3x + 2

b)

y = 1/3x + 2

c)

y = 3x + 2

d)

y = -3x + 2

28.

What is the equation of the line represented by the table?

a)

y = 2x - 6

b)

y = -2x + 5

c)

y = 3x + 2

d)

y = 2x + 3

29.

What is the equation of the line represented by the table?

a)

y = -3/4x - 4

b)

y = -4/3x - 4

c)

y = 3/4x + 4

d)

y = 4/3x + 4

30.
The cost of Nate’s service is described by y = 4x + 6. The table shows the cost of Beth’s service. Which service is cheaper for 8 movies in one month?
a)
Beth's service ($38 vs. $40) is cheaper
b)
Nate’s service ($42 vs. $44) is cheaper
c)
Nate’s service ($38 vs. $40) is cheaper
d)
Beth's service ($42 vs. $44) is cheaper
31.

Which function has the GREATEST rate of change?

a)
b)
c)
d)
32.

Which function has the GREATEST initial value?

a)
b)
c)
d)
33.

What has the GREATER rate of change.

a)

y = 7x + 10

b)

Someone who starts with $6 and gets $8 each day.

c)

y = 5x + 20

d)

Someone who starts with $8 and gets $6 each day.

34.

The graph shows the speed of Mr. Sam driving to work. Which section shows Mr. Sam stopped in traffic?

a)

a.

b)

b.

c)

g.

d)

d.

e)

f.

35.

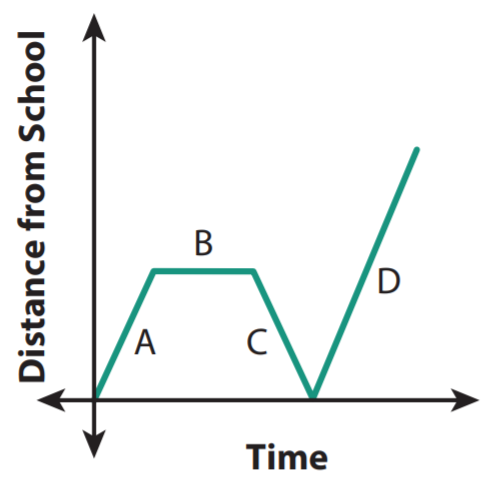
The graph shows Timmy's distance he is as he leaves school one afternoon. What happens in section C? Why is the distance from school decreasing?

a)

Timmy is walking back to school because he forgot his math book.

b)

Timmy is talking to a friend and not walking.

c)

Timmy is walking faster home.

d)

Timmy is dancing in the street.

36.

Choose the the graph that best depicts a man taking a ride on a ferris wheel.

a)

a

b)

b

c)

c

d)

d

37.

Choose the graph that best depicts a woman climbing a hill at a steady pace and then starts to run down one side.

a)

a

b)

b

c)

c

d)

d