
 Worksheets
PRACTICE Ecosystem Ecology & Biome quiz 2026
Total questions: 45
Worksheet time: 47mins
In a food chain or food web, in which direction does the arrow point?
toward the consumer
toward the animal being consumed
toward the energy source
toward the producer

The amount of energy that usually transfers from one trophic level to the next is roughly
An organism at the second trophic level would be considered a...
Top carnivore
Producer
Herbivore
Carnivore

The energy pyramid below shows the possible amount of energy (in Calories) available to organisms at each trophic level in an ecosystem. According to the Law of Conservation of Energy, energy can neither be created nor destroyed.
If this is true, why is there less energy at the top of the energy pyramid than there is at the bottom of the energy pyramid?
Energy is lost between each trophic level as heat.
The law of conservation of energy does not apply to ecosystems.
Organisms in the top of the energy pyramid use up energy the fastest.
The extra energy in the bottom is slower to reach the top.
Which of the following is a producer?
frog
algae
worm
mouse

If 100 Kcal of energy is available to the producers, how much energy would be available to the primary consumers?
10 Kcal
1 Kcal
100 Kcal
1000 Kcal

Which prey organism do the owl and the weasel compete for in the food web?
Hawk
Spider
Grasshopper
Shrew

Based on the image, which organism recieves the least amount of energy from the producer?
Owl
Grasshopper
Lilypad
Mouse
In a food web, arrows point at:
who gets energy.
who gets eaten.

A species that plays a critical role in the health, maintenance, growth, or definition of an ecosystem.
keystone
invasive
engineer
predator

What is a keystone species?
A species that helps to hold an ecosystem together
A species that lives in or around rocks
Keys and stones have nothing to do with ecology
A keystone isn't a living thing, it's just a stone


In which month do they get the most rain in this biome?
January
May
August
November

What is the temperature range (difference from warmest to coldest), in degrees Celsius, for this biome?
10
20
30
250

The ____ stays relatively stable over the whole year in this biome.
temperature
precipitation
temperature and precipitation
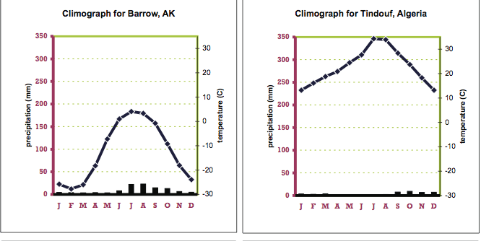
Which of the following is a similarity between these two biomes
low temperatures
high temperatures
low precipitation levels
permanently frozen ground
highly seasonal precipitation


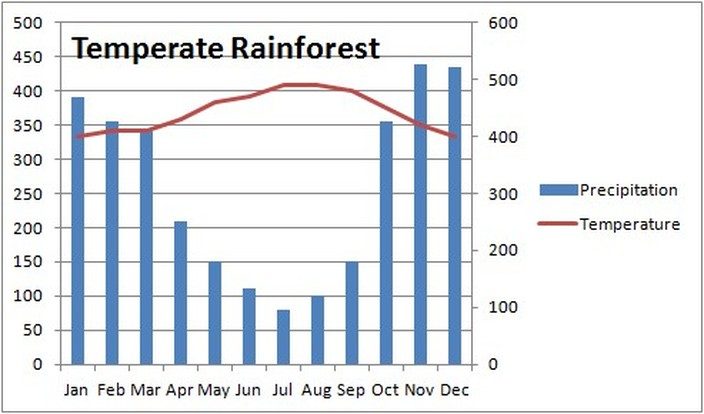

The biome shown in the climatogram above would best be described as a:
temperate deciduous forest
desert
tundra
tropical rain forest
The average weather of a place over many years
Weather
Climate
Tornado
Precipitation
Water that falls to the ground as rain, snow, sleet, or hail
Tropical Cyclone
Climate
Temperature
Precipitation
1. Some mountains located near the Earth's Equator have snow-covered peaks.
2. Icecaps exist at the Earth's poles.
The _______ of a mountain range is the side that receives a lot of precipitation.
windward side (where the wind hits first)
leeward side (also known as "downwind")

Cities that are closer to large bodies of water tend to have _____________ temperatures
more extreme temperature changes
less extreme temperature changes
4 distinct seasons
more sunshine
What type of organism is at the beginning of every food chain?
predator
carnivore
producer
herbivore
What do the arrows in a food web represent?
mass
energy flow
matter
organisms

Click on the photo to make it larger.
If the hawks suddenly disappeared, what could we expect to see happen to the other trophic levels?
We'd expect the frog population to increase, causing the insect population to decrease, causing the plant population to increase.
We'd expect the frog population to decrease, causing the insect population to increase, causing the plant population to decrease.
We'd expect to see the pyramid remain about the same, since only the top part was taken and not a part farther down and more important.
We'd expect to see the pyramid completely collapse, since the top was taken and that makes it the most important part, since that's where all of the energy comes from.
We have heard about the 10% rule or (Rule of 10). What happens to the other 90% of the energy?

What is the energy source that drives the water cycle?
The moon T
The heat from our home in the winter all around the world
The sun
The heat generated solely from the core of the earth

The process where plants absorb water through the roots and then give off water vapor through pores in their leaves. __________________________
Transpiration
Condensation
Evaporation
Precipitation
Fluxes (processes) of the water cycle include...
Precipitation, evaporation, condensation, & transpiration
Precipitation, heat energy, atoms released into the air, & atmosphere
Atmosphere, lithosphere, biosphere, & evaporation
Evaporation, condensation, atomic energy, thermal energy
Which of the following REMOVES carbon from the atmosphere?
Death & decomposition
Which describes the relationship between plants and animals in the carbon cycle?
Plants produce and release oxygen that animals need
Plants produce and release carbon dioxide that animals need
Animals produce and release oxygen that plants need
Animals produce oxygen that plants turn into carbon dioxide


Which food source would contribute to climate change the least?
Corn
Eggs
Pork
Beef
Label the visible parts of the water cycle.
Runoff
Evaporation
Transpiration
Condensation
Precipitation

