
 Worksheets
Unit 2 Review
Total questions: 22
Worksheet time: 26mins




y = 2x - 3
y = 1/5x + 5
Bob has $150 in his savings account and saves $40 per month. Which function models his savings?
y = 150 + 40
y = 40x + 150
y = 150x + 40
A man is climbing down from 100 feet high descending 30 feet per minute. Which function models his descent?
y = 100 - 30x
y = 100 + 30x
y = 100x + 30
y = 100x - 30

The graph represents the speed of a subway train. What is happening in the first part of the graph (the red section)?
The speed is decreasing.
The speed is increasing.
The speed is constant (stays the same).
The graph represents the speed of a subway train. What is happening in the middle part of the graph (the blue section)?
The speed is decreasing.
The speed is increasing.
The speed is constant (stays the same).
The speed decreases and then increases rapidly.

The graph shows the speed of Mr. Sam driving to work. Which section shows Mr. Sam stopped in traffic?
a.
b.
g.
d.
f.
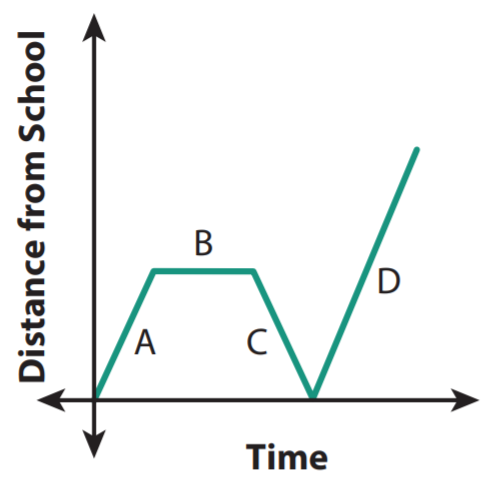
The graph shows Timmy's distance he is as he leaves school one afternoon. What happens in section C? Why is the distance from school decreasing?
Timmy is walking back to school because he forgot his math book.
Timmy is talking to a friend and not walking.
Timmy is walking faster home.
Timmy is dancing in the street.

