
 Worksheets
GRAPHICAL REPRESENTATION OF MOTION
Total questions: 40
Worksheet time: 38mins

Distance-time graph of two objects A and B are shown below. Choose correct option.
Speed of object A is greater than object B
Speed of object A is smaller than object B
Both have same speed
Speed of Object A is double the speed of object B.
Which of the following figures represent uniform motion of a moving object correctly?


The figure above shows distance-time graphs of two objects X and Y. Which object is moving with greater speed?
Both objects are at rest
Both objects are moving with same speed
Object Y
Object X

The velocity time graph of two bodies A and B traveling along the +x direction are given in the figure. Which body is moving with greater acceleration A or B?
A
B





Distance-time graph of two objects A and B are shown below. Choose correct option.
Speed of object A is greater than object B
Speed of object A is smaller than object B
Both have same speed
Speed of Object A is double the speed of object B.
Which of the following figures represent uniform motion of a moving object correctly?

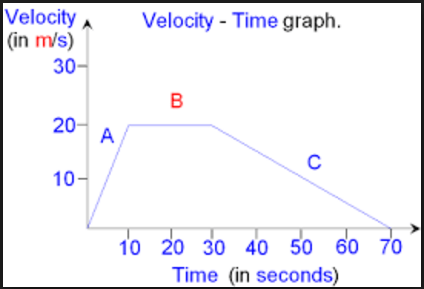
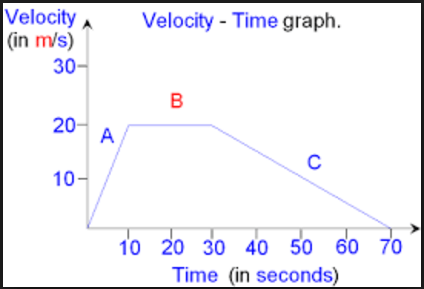
What is the speed of the object in the interval 40-50 seconds?
2
1
0.25
0.5
The figure above shows distance-time graphs of two objects X and Y. Which object is moving with greater speed?
Both objects are at rest
Both objects are moving with same speed
Object Y
Object X
The velocity time graph of two bodies A and B traveling along the +x direction are given in the figure. Which body is moving with greater acceleration A or B?
A
B
What does the slope of a position vs time graph tell you?
initial position
velocity
final position
the stopping point of an object
How do you find displacement from a velocity vs time graph?
find the change in velocity
add up velocity values of each horizontal line
find the area under the curve
determine the change in time for the entire graph
Which of the following figures represent uniform motion of a moving object correctly?
The velocity time graph of two bodies A and B traveling along the +x direction are given in the figure. Which body is moving with greater acceleration A or B?
A
B

Which of the following does NOT describe the given V-T graph?
It has a constant positive velocity.
It has a zero acceleration.
The object is at rest.
Which of the following shows a positive constant acceleration?


Which of the following figures represent uniform motion of a moving object correctly?
What is the quantity measured by the area occupied below velocity - time graph
Speed
Velocity
Distance
Time
Distance-time graph of two objects A and B are shown below. Choose correct option.
Speed of object A is greater than object B
Speed of object A is smaller than object B
Both have same speed
Speed of Object A is double the speed of object B.
Which of the following shows a positive constant acceleration?
What equation is Distance/ Speed
time
speed
velocity
distance

