
 Worksheets
Secondary Math One Review
Total questions: 30
Worksheet time: 54mins


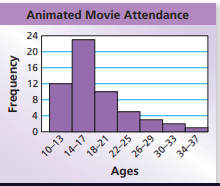
What is the shape of the data?
symmetrical
skewed left
skewed right
bell curve

What is the shape of the data?
symmetrical
skewed left
skewed right
bell curve




What is the shape of the distribution?
Skewed Left
Skewed Right
Symmetric
Uniform


x > -3 or x > 1
x < -3 or x < 1
x ≥ 3 and x ≤ 1
x > -3 and x < 1

x < 0 or x ≥ 2
x < 0 or x > 2
x ≤ 0 or x ≥ 2
x ≤ 0 or x > 2

The outside temperature and the amount of layers you wear.


Mrs. Collins made a scatterplot to show the relationship between the number of absences and a student’s final exam score. Based on this scatterplot, a student with 6 absences should get approximately what score on the final exam?
65
92
70
76

Estimate the correlation coefficient for this scatterplot.
r = 1.2
r = 0.89
r = 0
r = -0.89

Estimate the correlation coefficient for this scatterplot.
r = -0.9
r = 1
r = 0.9
r = -1

which equation best represents this graph?
y < 1/2x + 1
y < 1/2x + 2
y >1/2x + 2
y > 2x


Identify the inequality.
y > 2
y ≤ 1
x ≥ 2
y ≥ 1


