
 Worksheets
Distance Time Graphs & Velocity Time Graphs
Total questions: 20
Worksheet time: 40mins

At 60 seconds, how far had this object traveled?
0 m
10 m
20 m
40 m


What does this graph represent?
Constant motion
Acceleration/ speeding up
Stationary motion

What is happening at A?
Stationary
Accelerating
Constant
Which graph below shows 2 runners moving at the same speed?


Which graph shows a car traveling at a constant speed?

None of these graphs


At segment O-A, the bus is _________________.
at rest
accelerating
moving constantly

How long did Bob take to complete the race?
17 seconds
12 seconds
14 seconds
15 seconds

What was occurring from point B to point C?
Which of these graphs do not show the object staying still?


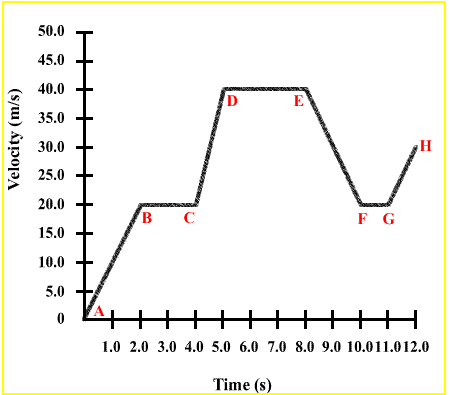
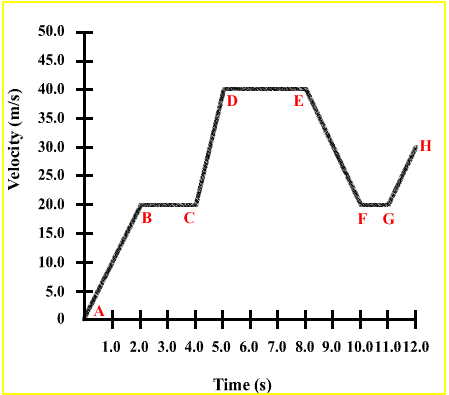


The gradient of a velocity-time graph represents __________.
speed
acceleration
distance
none of these
The area under a velocity-time graph represents __________.
distance
speed
acceleration
none of these

Calculate the distance travelled in section B.
100 m
150 m
250 m
none of these

Calculate the distance travelled in section A.
150 m
75 m
100 m
none of these
The gradient of a distance - time graph is equal to the
speed
distance
acceleration
none of these
When we talk about the gradient of a line, it is equal to the
rise / run
run / rise
none of these

