Worksheets
Data Handling
Total questions: 17
Worksheet time: 12mins


Which subject do students like the least?
math
reading
social studies

Which pet got the most votes?
Dog
Cat
Fish

How many matches got 3 goals?
2
3
4
5

What animal has least likes?
budgie
rabbit
lizard
hamster

How many more cakes on Wednesday and Thursday?
10 cakes
25 cakes
20 cakes
15 cakes

Look at this pictogram.How many cup cakes sold on Wednesday?
4
24
28

This tally chart shows learners' favourite animals.
How many learners like Tiger and Deer?
25
26
15

This pictograph shows pumpkins picking by six people.
How many pumpkins did Nina pick?
Hint : Look carefully to the given key and then write your answer.
16
15
6

which type of graph is this???
BAR GRAPH
PICTOGRAPH
TALLY MARK
STIMY GRAPH

How many Apples were sold in Thursday and Friday together???
21
22
23
12

How many people loved decorating the tree???
9
5
6
3

What is this chart called?
(a)

What type of graph is this?
(a)

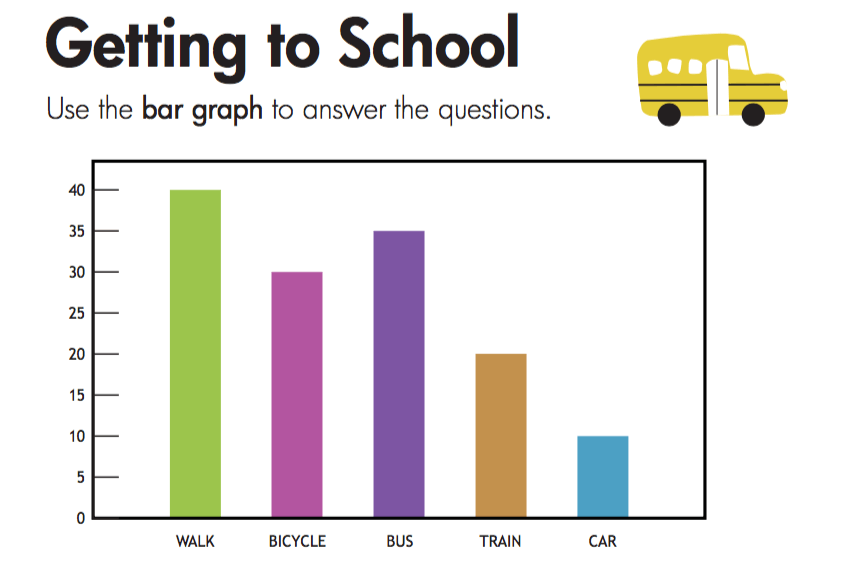
What is the most popular mode of transport to work?
Park and ride
Car
Walk
Cycle