Wayground logo

Free Printable Worksheets

Font size

S
M
L
XL
Worksheets

graphs

Total questions: 65

Worksheet time: 2hrs 38mins

Name
Class
Date
1.
How many more people like red than purple?
a)
100
b)
10
c)
2
d)
5
2.
How many people voted for red as their favorite color?
a)
100
b)
2
c)
4
d)
9
3.
How many students like vanilla and chocolate?
a)
8
b)
32
c)
30
d)
28
4.
How many more students like soccer than basketball?
a)
24
b)
15
c)
10
d)
17
5.
How many students like hockey and football?
a)
21
b)
3
c)
12
d)
9
6.
How many students voted for their favorite sport?
a)
38
b)
17
c)
40
d)
50
7.
What type of graph is this?
a)
bar graph
b)
pictograph
c)
tally chart
8.

Mary is recording her plant's growth in a journal. How many inches has the plant grown from week 1 to 7?

a)

22

b)

18

c)

14

9.
What is the name of this graph?
a)
line plot
b)
line graph
c)
bar graph
d)
frequency table
10.
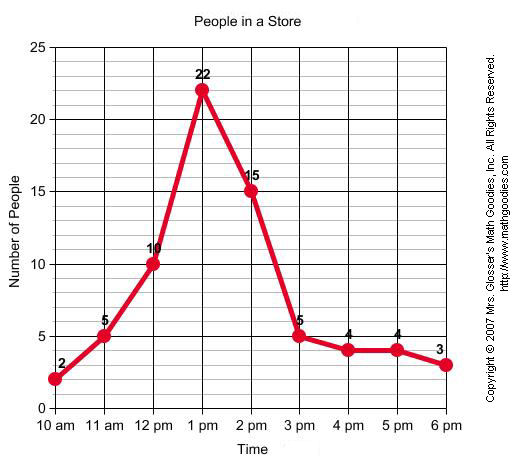
When was the greatest amount of shoppers at the store?
a)
10am
b)
1pm
c)
6pm
d)
2pm
11.
What was the bear population in 2001?
a)
40
b)
45
c)
50
d)
55
12.

Between which two years did the bear population remain constant or the same?

a)

2004 and 2005

b)

2001 and 2002

c)

2005 and 2006

d)

2000 and 2001

13.
Between which two times was the greatest increase in number of shoppers?
a)
12pm and 1pm
b)
1pm and 2pm
c)
2pm and 3pm
d)
10am and 11am
14.
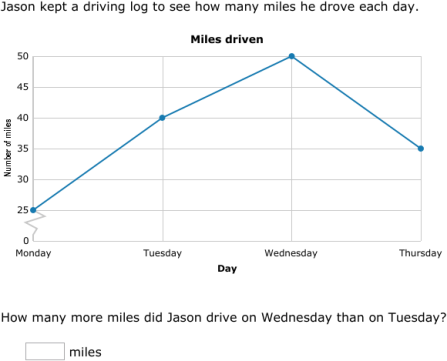
How many more miles did Jason drive on Wednesday than on Tuesday?
a)
40 miles
b)
10 miles
c)
5 miles
d)
50 miles
15.

What kind of graph shows change over time?

a)

bar graph

b)

line graph

c)

line plot

d)

pie graph

16.

How many hot dogs were sold altogether?

a)

30 hot dogs

b)

100 hot dogs

c)

180 hot dogs

d)

80 hot dogs

17.

How many more shells did Mabel collect on Day 2 compared to Day 1?

a)

8

b)

4

c)

2

d)

6

18.

How many people like Peanut Butter Cookies?

a)

5

b)

6

c)

4

d)

7

19.

What was the most favorite kind of cookie?

a)

Oatmeal

b)

Chocolate Chip

c)

Peanut Butter

20.

Which was the least favorite dinosaur?

a)

T-rex

b)

Velociraptor

c)

Stegosaurus

21.

What was the MOST liked drink?

a)

Milk

b)

Hot Cocoa

c)

Juice

22.

Who has the most marbles?

a)

Alec

b)

Lucy

c)

June

d)

Mike

23.

Which Fruit Has The Most Votes?

a)

Apple

b)

Pear

c)

Grape

d)

Banana

24.

Which Fruit Has The Least Votes?

a)

Apple

b)

Pear

c)

Grape

d)

Banana

25.

How Many More People Voted For Apple Than Banana

a)

6

b)

8

c)

2

d)

4

26.

How many children chose paintbrush?

a)

2

b)

5

c)

6

27.

How many children chose crayon?

a)

2

b)

5

c)

6

28.

Which art tool did the fewest children choose?

a)

Markers

b)

Paintbrushes

c)

Crayons

29.

The bar graph above shows students' voting on their favorite fruit. Question: How many more kids voted for strawberry than banana?

a)

0

b)

1

c)

2

d)

3

30.

How many individuals prefered goldfish or hamsters?

a)

12 individuals

b)

4 individuals

c)

8 individuals

d)

6 individuals

31.
How many people like fish best?
a)
10
b)
4
c)
6
d)
5
32.

How many fewer did I.M. Sikk eat than Bell E. Ake?

a)

6

b)

7

c)

5

d)

8

33.

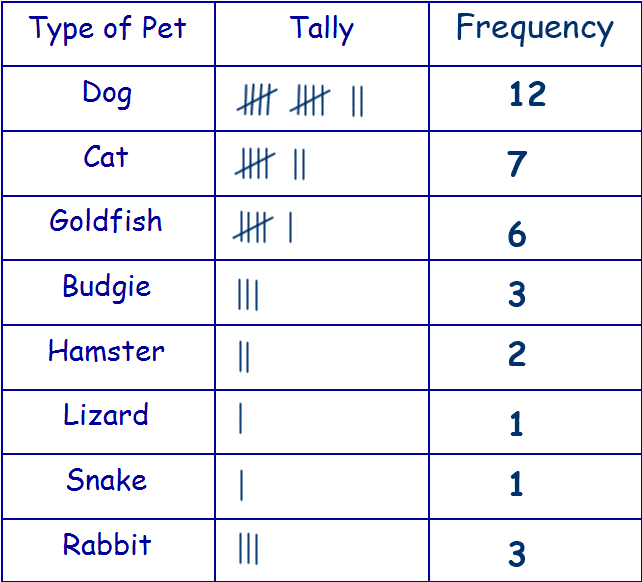
Which is the most popular pet?

a)

Dog

b)

Cat

c)

Hamster

d)

Rabbit

34.

Which are the least popular pets?

a)

Cats and dogs

b)

Goldfish and budgie

c)

Lizard and snake

d)

Hamster and rabbit

35.

Which pet was chosen by 6 people?

a)

Cat

b)

Goldfish

c)

Hamster

d)

Snake

36.

Which pet was chosen by 2 people?

a)

Dog

b)

Cat

c)

Lizard

d)

Hamster

37.
Range:
67, 74, 95, 98, 98, 99, 102
a)
102
b)
67
c)
98
d)
35
38.
Range:
67, 74, 95, 98, 98, 99, 102
a)
102
b)
67
c)
98
d)
35
39.
Median:
67, 74, 95, 98, 98, 99, 102
a)
102
b)
67
c)
98
d)
90.4
40.

What is the range?

a)

The sum of the largest and smallest number

b)

The number in the middle

c)

The difference between the largest and smallest number

d)

The number that appears most often

41.

What is the median?

a)

The number in the middle when the numbers are in order from least to greatest.

b)

The difference between the largest and smallest number.

c)

The average

d)

The number that appears most often.

42.
What is the mode?
a)
The average
b)
The number that appears most often.
c)
The largest number - the smallest number
d)
The number in the middle.
43.
To find the average of a set of numbers, add up all the items and divide by...
a)
2.
b)
The smallest number
c)
The largest number
d)
The number of items in the set.
44.
In order to find the median, the data must be sorted from least to greatest first.
a)
True
b)
False
45.

The mean is also called the ...

a)

middle

b)

most

c)

average

d)

difference

46.

Find the mean: 10, 11, 8, 14, 12, 8, 4, 5

a)

72

b)

8

c)

9

47.

How many students are in the class?

a)

25

b)

19

c)

10

d)

1

48.
How many days did it snow MORE than 4/8 of an inch?
a)
10
b)
7
c)
8
d)
4
49.
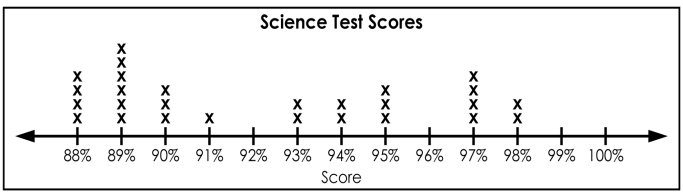
How many students received a score in the 80's?
a)
2
b)
10
c)
14
d)
27
50.
How many students scored 93% or less?
a)
6
b)
16
c)
14
d)
13
51.

Ms. Campbell is grading her 5th Grade Math Students Line Plot quiz.

Here's the data (Grades):

65, 95, 100, 75, 65, 80, 60, 90, 95, 100, 75, 95, 95, 85, 80, 70, 100, 85, 60, 100


Which Number Line is accurate enough for the data?

a)
b)
c)
d)
52.
How many students were greater than or equal to 60 inches tall?
a)
21
b)
11
c)
17
d)
6
53.
Which interval shows the greatest number of pets?
a)
15-19
b)
0-4
c)
5-9
d)
10-14
54.
Which interval has 4 students?
a)
56-59
b)
60-63
c)
60-67
d)
48-51
55.
How many men had finishing times between 60 and 64 minutes?
a)
9
b)
0
c)
7
d)
5
56.

Lindsey wants a new bike that costs $230.  Her father said that if she saves up 310\frac{3}{10}  of the cost, he will pay the rest.  How much money does Lindsey need to save?

a)

$23

b)

$30

c)

$69

d)

$72

57.

According to the following circle graph, what is the least favorite beverage?

a)

Coffee

b)

Cola

c)

Water

d)

Tea

58.
600 people were surveyed. How many people rode the stationary bikes that day?
a)
150 people
b)
120 people
c)
90 people
d)
None of these
59.
According to this graph, what is the most popular flavor of Jolly Rancher?
a)
Cherry
b)
Grape 
c)
Blue Rasberry
d)
Watermelon
60.
A die is rolled once.  What is the probability of rolling a 5? Your answer should be a fraction in simplest form.
a)
1/6
b)
1/3
c)
2/5
d)
5/6
61.
A die is rolled once.  What is the probability of rolling an odd number? Your answer should be a fraction in simplest form.
a)
1/6
b)
1/2
c)
3/6
d)
2/5
62.
A die is rolled once.  What is the probability of rolling a 5 or a 6? Your answer should be a fraction in simplest form.
a)
5/6
b)
2/6
c)
1/3
d)
1/5
63.
A die is rolled once.  What is the probability of rolling a number less than 3? Your answer should be a fraction in simplest form.
a)
1/3
b)
2/6
c)
3/6
d)
1/6
64.
A jar contains 2 pink, 6 red, and 4 blue marbles. If you pick one marble without looking, what is the probability that the marble you pick will be red or blue?
a)
5/6
b)
1/2
c)
1/3
d)
1/6
65.
A bag has 3 red marbles, 2 blue and 4 yellow. What is the theoretical probability of pulling a red?
a)
3/10
b)
3/9
c)
1/9
d)
1/3