
 Worksheets
Statistics Diagrams
Total questions: 60
Worksheet time: 3600secs
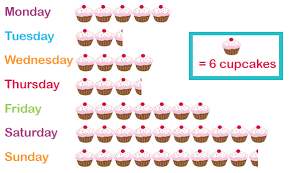
How many cupcakes where made on Thursday?
3 and half
18
21
19
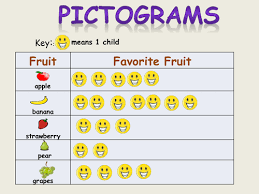
How many children participated in the survey?
6
42
17
21
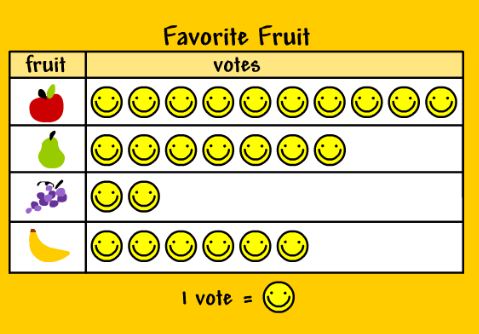
Based on this pictogram, what is the most favourite fruit?
Apple
Guava
Grape
Banana

Which pizzeria has the second largest sales?
Pizza House
Domiano's Pizza
Little Secrets Pizza
Uncle John's Pizza
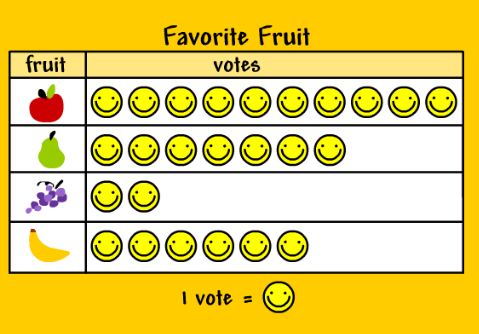
How many students like banana and grape?
5
6
7
8

What is the least favourite fruit in this pictogram?
Apple
Guava
Grape
Banana

How many students are there in the class altogether?
25
20
19
18
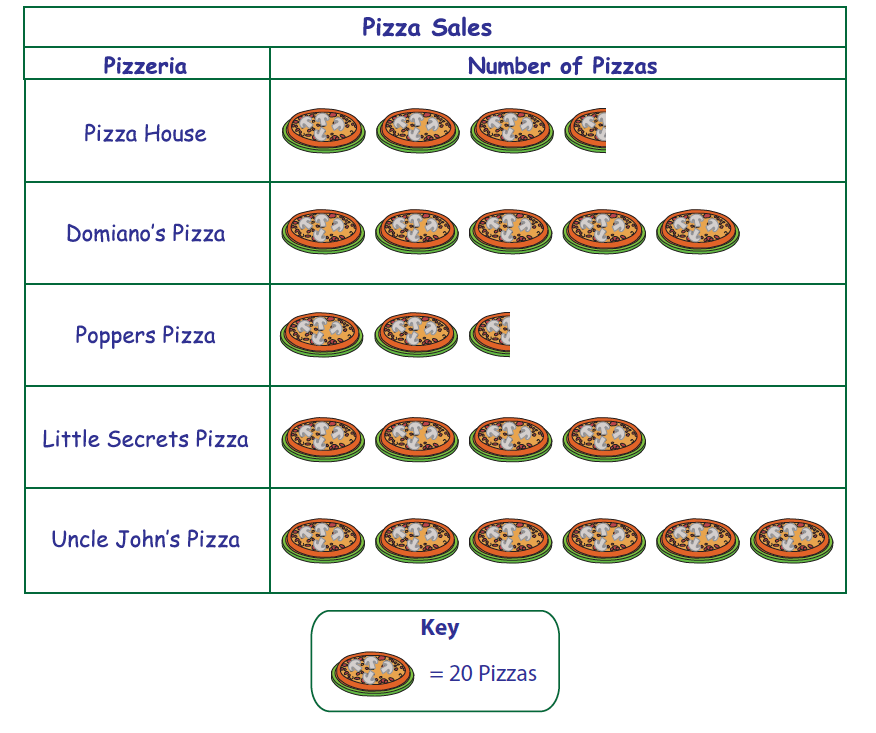
How many more pizzas were sold by Uncle John's Pizza than Little Secrets Pizza?
40
200
210
45


How many hours did James spend revising on Monday?
2
1
4
6
How many hours did James spend revising on Wednesday?
1.5
3
2
4
On which day did James spend 6 hours revising?
Monday
Tuesday
Wednesday
Thursday

Who raised the most money?
Ben
Cara
Dylan
Ellie
Who raised the least money?
Ben
Cara
Dylan
Ellie
How much money did Dylan raise?
£20
£25
£30
£35

The pictogram shows the number of hours of sunshine in one day.
Which city had the most sunshine?
Paris
Cork
London
Swansea
The pictogram shows the number of hours of sunshine in one day.
How many hours of sunshine did Swansea have?
2 hours
2.25 hours
8
9
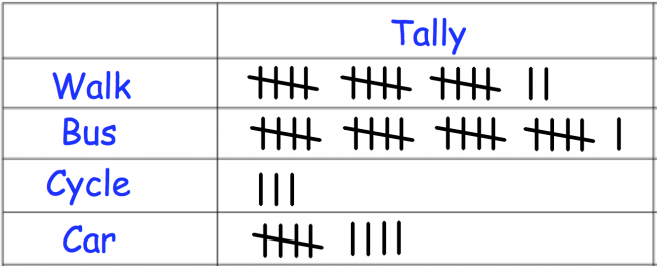
How many people walk to school?
17
15
21
11
How many people get the bus to school?
16
26
21
11
How many people cycle to school?
3
15
4
2
How many people travel by car to school?
9
11
14
8

A restaurant recorded the number of pizzas sold each month for one year. The data are shown in the graph below. During which month did the restaurant sell 40 pizzas?
March
May
July
August

Which month had the biggest difference between the high and low temperatures?
January
April
October
November

Annie recorded the amount of rain that fell each day. The results are shown in the line graph below. How many centimeters of rain fell on the third day?
2
3
4
7


The graph shows the number of inches a plant grew each week.
Between which 2 weeks did the plant grow the MOST?
Week 1 and Week 2
Week 2 and Week 3
Week 3 and Week 4
Week 4 and Week 5

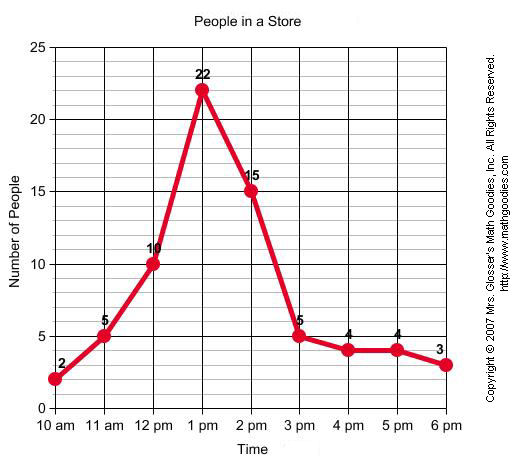



In which month the sale increased
July
June
May
August
Which month did the restaurant sell 40 pizzas?
March
May
July
August

How many mountain bikes were sold?
22
28
16
6

How many students take the bus to school?
35
20
10
15
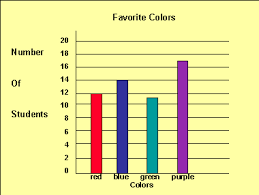
How many more people have purple for a favourite colour than red?
3
5
7
9

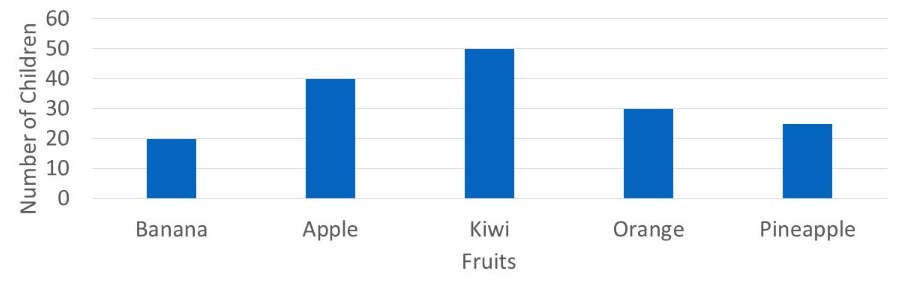
Which of the following statements is true?
banana is the most popular fruit
only pineapple is liked less than oranges
kiwi is the most popular fruit
apple is the third most popular fruit
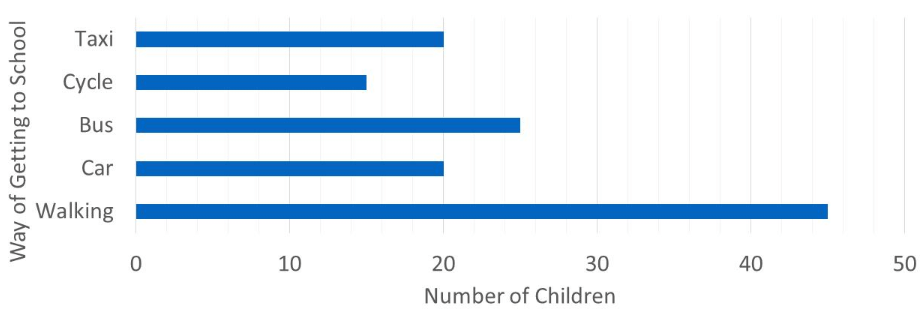
How many more children walk than take the bus to school?
45
20
25
10
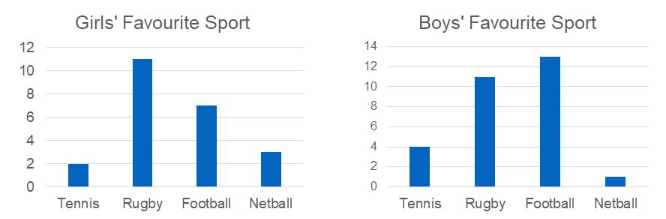
Which sport was picked by the same number of girls and boys?
tennis
football
netball
rugby
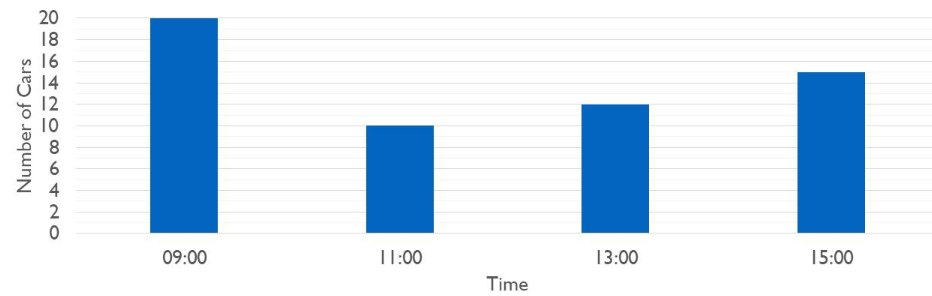
How many more cars pass at 15:00 than at 11:00?
10
5
4
3

What type of graph is this?
bar chart
pictogram
tally chart
line chart

a) What's the color has the most number of people like it?
(Màu nào có số bạn thích nhiều nhất?)
Red
Blue
Green
Yellow
Pink

b) What's the color has the lest number of people like?
(Màu nào có số bạn thích ít nhất?)
Red
Blue
Green
Yellow
Pink

b) What's the score of handball and basketball altogether?
(handball=25; basketball=40)
40-25=15 (scores)
25+40=65 (scores)
25+40=100 (scores)

a) What's sport has the most score?
Football
Basketball
Gymnastic
Handball
Tennis

c) Gymnastic or tennis have more score than? How much more?
Gymnastic, more than 2
Tennis, more than 10
Tennis, more than 5

Choose the day has the lest car crashed.
Wednesday
Tuesday
Thursday
Sunday
Saturday

a) Which grade has the most number of students?
A
B
C
D
E

b) Count the number of students grade D,A have altogether. A=8;D=3
12
14
17
11

There are 600 bananas. How many more Pineapples are there than peaches?
400
200
100
150

How many degrees do the Peach, Banana and Pineapple take up of the pie chart?
60
120
190
216

There are 200 peaches. How many oranges are there?
230
260
130
360

What percentage of people like Dogs the most?
120%
40%
110%
33%

There are 360 animals total. How many are NOT fish?
40
300
320
280

There are 700 dogs. How many animals are there total?
1400
2100
1800
1100

Cats and Goats are equal. There are 1000 animals total. The cats account for 120˚ of the pie chart. How many goats are there?
400.66
396.12
333.33
360.67

Goats and Cats have the same amount. The number of Dogs is equivalent to which animals?
Cows, goats, donkeys
Chickens, cows, donkeys,
Chickens, cats, fish
Chickens, donkeys, goats

Do more people enjoy Ham and pineapple or Pepperoni and Pepper?
Pepperoni and Pepper
Ham and Pineapple
What angle would you use to represent 40 red cars out of 90 cars in total on a pie chart?
40 degrees
160 degrees
4 degrees
90 degrees

The pie chart shows the colours of 32 beads. How many green beads are there?
90
8
11
9

