
 Worksheets
Year 10 Economics
Total questions: 44
Worksheet time: 30mins
What is a consumer?
a person who takes things
a person who purchases goods and services for personal use
a person who takes good away
the economic factors affecting the price, demand, and availability of a commodity
What is a producer?
a person who gives goods away
things people would like to have
the exchanged of goods and services without the use of money
a person, company, or country that makes grows, or supplies goods for sale
Basic things humans need to survive
want
import
need
Extras that make life more enjoyable
need
want
savings
What is Gross Domestic Product?
Goods, services, and intermediate products bought by people in other countries.
the total value of goods produced and services provided in a country during one year
The amount of output the average worker can produce in an hour.
Which choice best describes the economic problem of scarcity in the world?
People have limited wants there is an unlimited amount of resources.
People have unlimited wants but there is a limited amount of resources
People have no wants so resources don't matter
In the circular flow diagram firms pay wages for which factor of production?
Land
Labor
Entrepreneurship
Raw materials
Where do factors of production (land, labor, etc) come from in the circular flow model?
Factor Market
Producers
The Government
Households
Government use taxes to produce
Leaders for the government
Weapons for the military
Public Goods and Services
Television Commercials
Which of the following describes a machine used to produce a product?
Land
Labor
Capital
Entrepreneurship
Which of the following is a worker?
Land
Labor
Capital
Entrepreneurship
What do households provide to the resource market?
land, labor, capital, and entrepreneurship
money
people
income
What do households sell?
Products
Goods & Services
Factors of Production
Expenditures

If a point lies on the curve this means the company/country/individual is being efficient. If a point lies inside the curve, what does that tell?
They are being over efficient
They are being inefficient
It is not impossible with the given resources
They are still efficient, just at another point
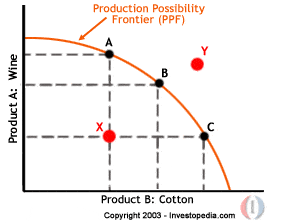
How does a production possibility curve show that scarcity exists?
It shows that a rise in demand for one of the products increases its price.
It shows that as more resources are used to produce a product, its price rises.
It shows that at any point outside the production possibility curve an economy is wasting
resources.
It shows that there is a limit to the quantity of products that can be produced with existing resources and technology.

The diagram shows two production possibility curves for an economy.
What could have caused the change in the economy’s production possibility curve from XX
to YY?
a decrease in the price level
a large number of industrial disputes
a major earthquake
an increase in unemployment
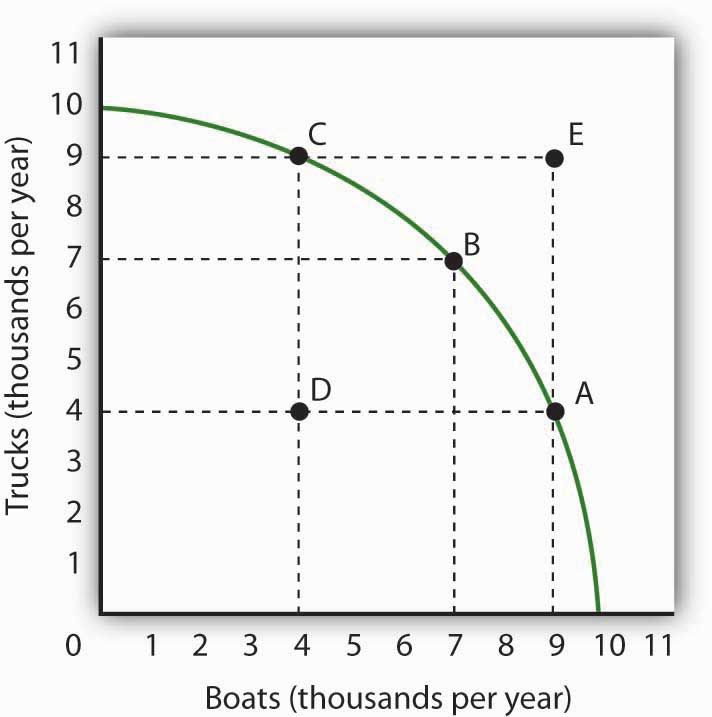
What determines the prices of goods and services?
Supply
Demand
Supply and demand
Goods
What exists when quantity supplied is greater than quantity demanded?
Surplus
Shortage
Overflow
Mass outrage
A market is said to be in equilibrium when
when demand is higher than the supply
when demand is lower than the supply
when the demand and supply quantities are equal
when the supply is doubled the demand
What happens to price when the market has a surplus
price drops
price stays the same
price increases
price triples
Defined as: the goods and services produced in one country and purchased by residents of another country
import
export
embargo
economy
Defined as: to bring in a product or service from another country.
imports
goods
services
exports
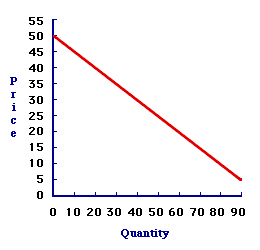
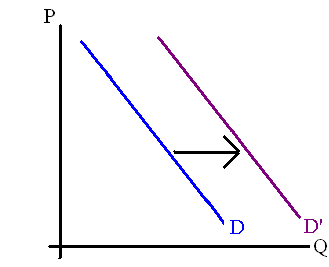
When the demand curve shifts to the left, this suggests demand has
increased
decreased
Quantity demanded has increased
Quantity demanded has decreased
When the demand curve has shifted to the right, this suggests demand has
increased
decreased
quantity demanded has increased
quantity demanded has increased
Which statement expresses a central idea of how the laws of supply and demand work?
The government sets the prices for goods and services.
Prices are determined by the interaction of producers and consumers.
Consumers alone determine the prices for goods and services.
Technology dictates the prices charged for goods and services.
Which factor might cause an increase in the supply of a product?
a decrease in productivity
fewer sellers in the marketplace
the introduction of new technology
an increase in the cost of raw materials
The law of supply states...
the supply of a product is not affected by its price.
when the supply of a product decreases, the price of the product falls.
when the supply of a product increases, the price of the product rises.
the quantity supplied of a product will increase when the price of that product increases.
Income
Consumer Expectations
Population
Consumer Tastes
Complements and Substitutes
These would change what part of the market?
supply
demand
Quantity supplied
Quantity demanded

This demand and supply graph shows:
An increase in Demand and an expansion in Supply
A decrease in Demand and a contraction in Supply
An increase in Supply and an expansion in Demand
A decrease in Supply and a contraction in Demand

This demand and supply graph shows:
An increase in Demand and an expansion in Supply
A decrease in Demand and a contraction in Supply
An increase in Supply and an expansion in Demand
A decrease in Supply and a contraction in Demand

This demand and supply graph shows:
An increase in Demand and an expansion in Supply
A decrease in Demand and a contraction in Supply
An increase in Supply and an expansion in Demand
A decrease in Supply and a contraction in Demand

This demand and supply graph shows:
An increase in Demand and an expansion in Supply
A decrease in Demand and a contraction in Supply
An increase in Supply and an expansion in Demand
A decrease in Supply and a contraction in Demand
The aggregate demand equation is:
Y=C+I+G+X
Y=C+I+G+(X+M)
Y=C+I+G+(X-M)
C+S+T+M=C+I+G+X

