
 Worksheets
Motion 1
Total questions: 60
Worksheet time: 1hrs 29mins


A runner races in the 100 meter dash. It takes her 10 seconds to finish. What is her average speed?
10 m/s
1000 m/s
100 seconds
10 seconds

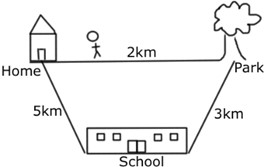
Jerry walked from home to school, then from the school to the park. What is his total displacement?
2 km
5 km
8 km
10 km
Jerry walked from home to school, then from the school to the park. What is his total distance?
2 km
5 km
8 km
10 km
A cat walks 3 meters toward a laser, then jumps 5 meters due south of the laser when it sees a thing. What is the displacement of the cat (to the nearest tenth)?
3.0m
5.0m
8.0m
5.8m
Jermaine runs exactly 2 laps around a 400 meter track. What is the displacement?
800 meters
400 meters East
0 meters
200 meters SW
Jerry walked from home to school, then from the school to the park. What is his total distance?
2 km
5 km
8 km
10 km
Jerry walked from home to school, then from the school to the park. What is his total displacement?
2 km E
5 km E
8 km N
10 km NE
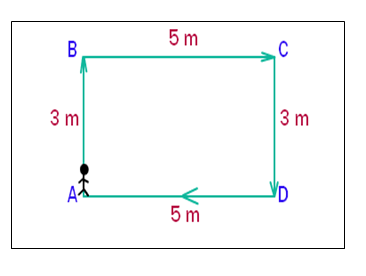
Scott travels north 5 miles and then goes west 3 miles before coming straight back south 2 miles. What is his distance?
10 miles
7 miles
8 miles
6 miles

From the figure, what is the displacement?
20 meters
25 meters
15 meters
25 meters NE
The change and direction in an objects position from the final position to initial position.
displacement
distance
motion
reference point

An object is __________ when its distance from a reference point is changing.
in motion
speeding
not moving
at rest
________ can be calculated if you know the distance an object traveled and the unit of time. (distance ÷ time)
Speed
Motion
Opportunity
Velocity
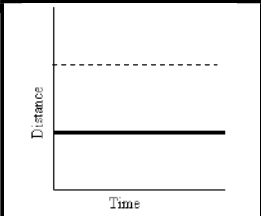
What does the solid line on this graph represent?
Constant speed
Acceleration
At rest
deceleration
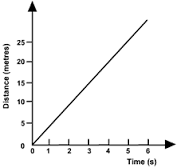
What is the line on this graph showing?
moving away from starting point at a constant speed
moving back towards the starting point at a constant speed
acceleration (getting faster)
deceleration (getting slower)
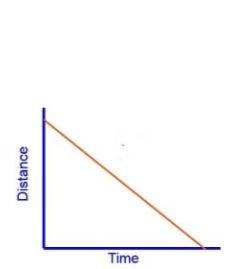
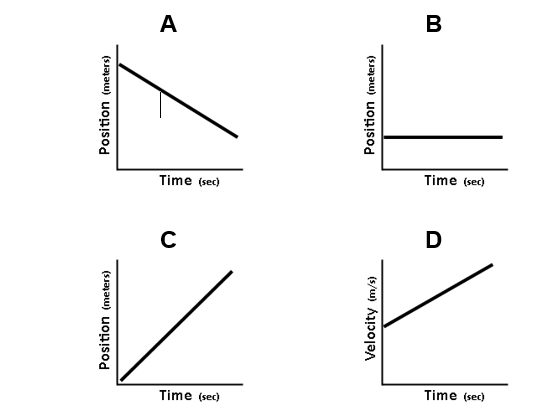
What is this line of this graph showing?
moving away from starting point at a constant speed
moving back towards the starting point at a constant speed
acceleration (getting faster)
deceleration (getting slower)



The graph represents the motion of a car over 10 seconds. What is the average speed of the car during the first 4 seconds? (Hint: distance 10 meters and time 4 seconds)
.4 m/s
2.5 m/s
10 m/s
40 m/s
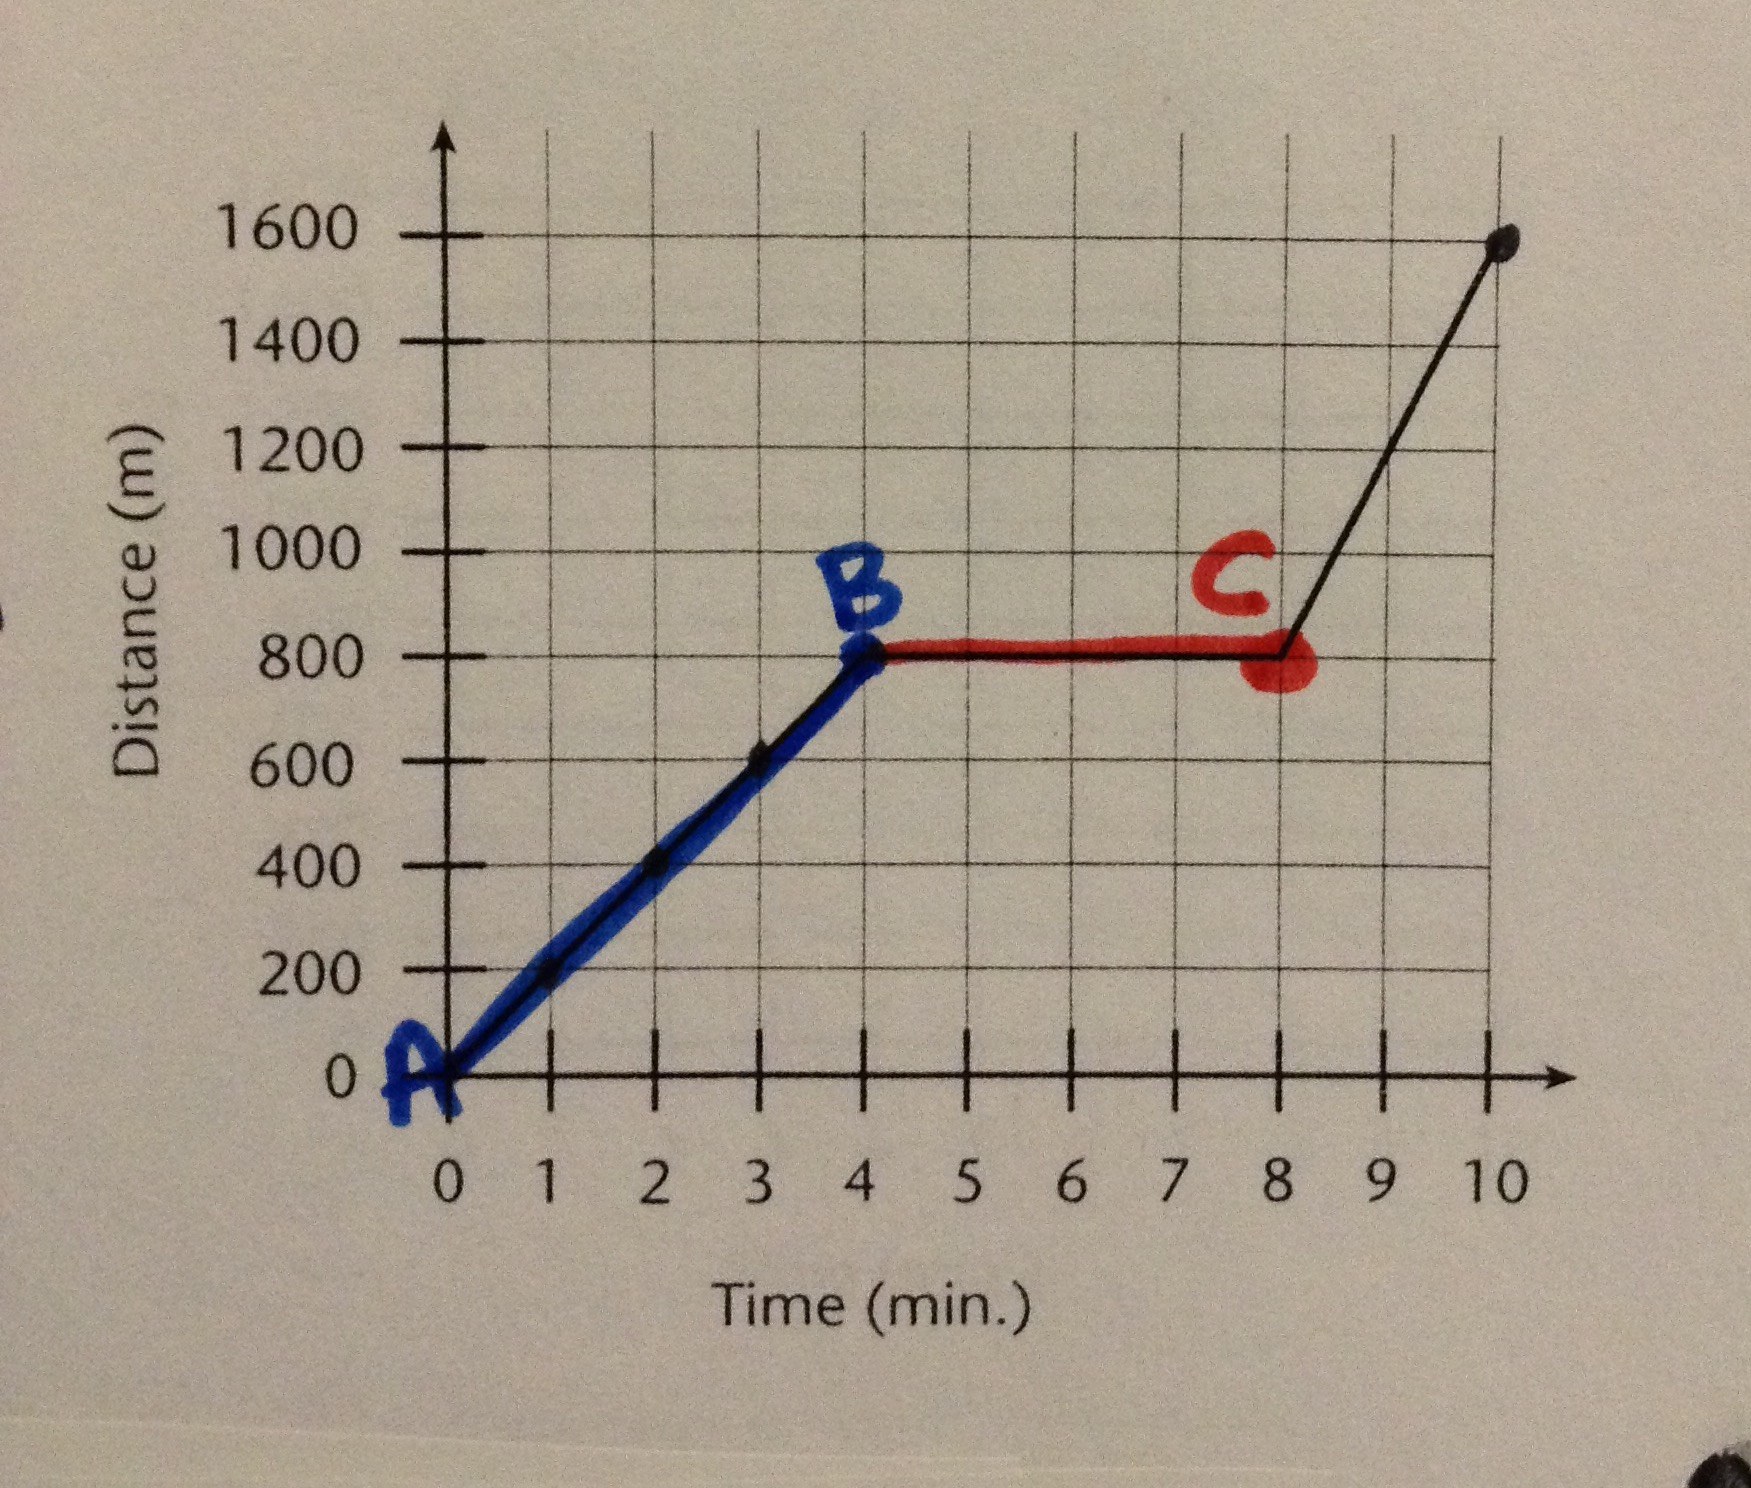
What is occurring from point A to point B?
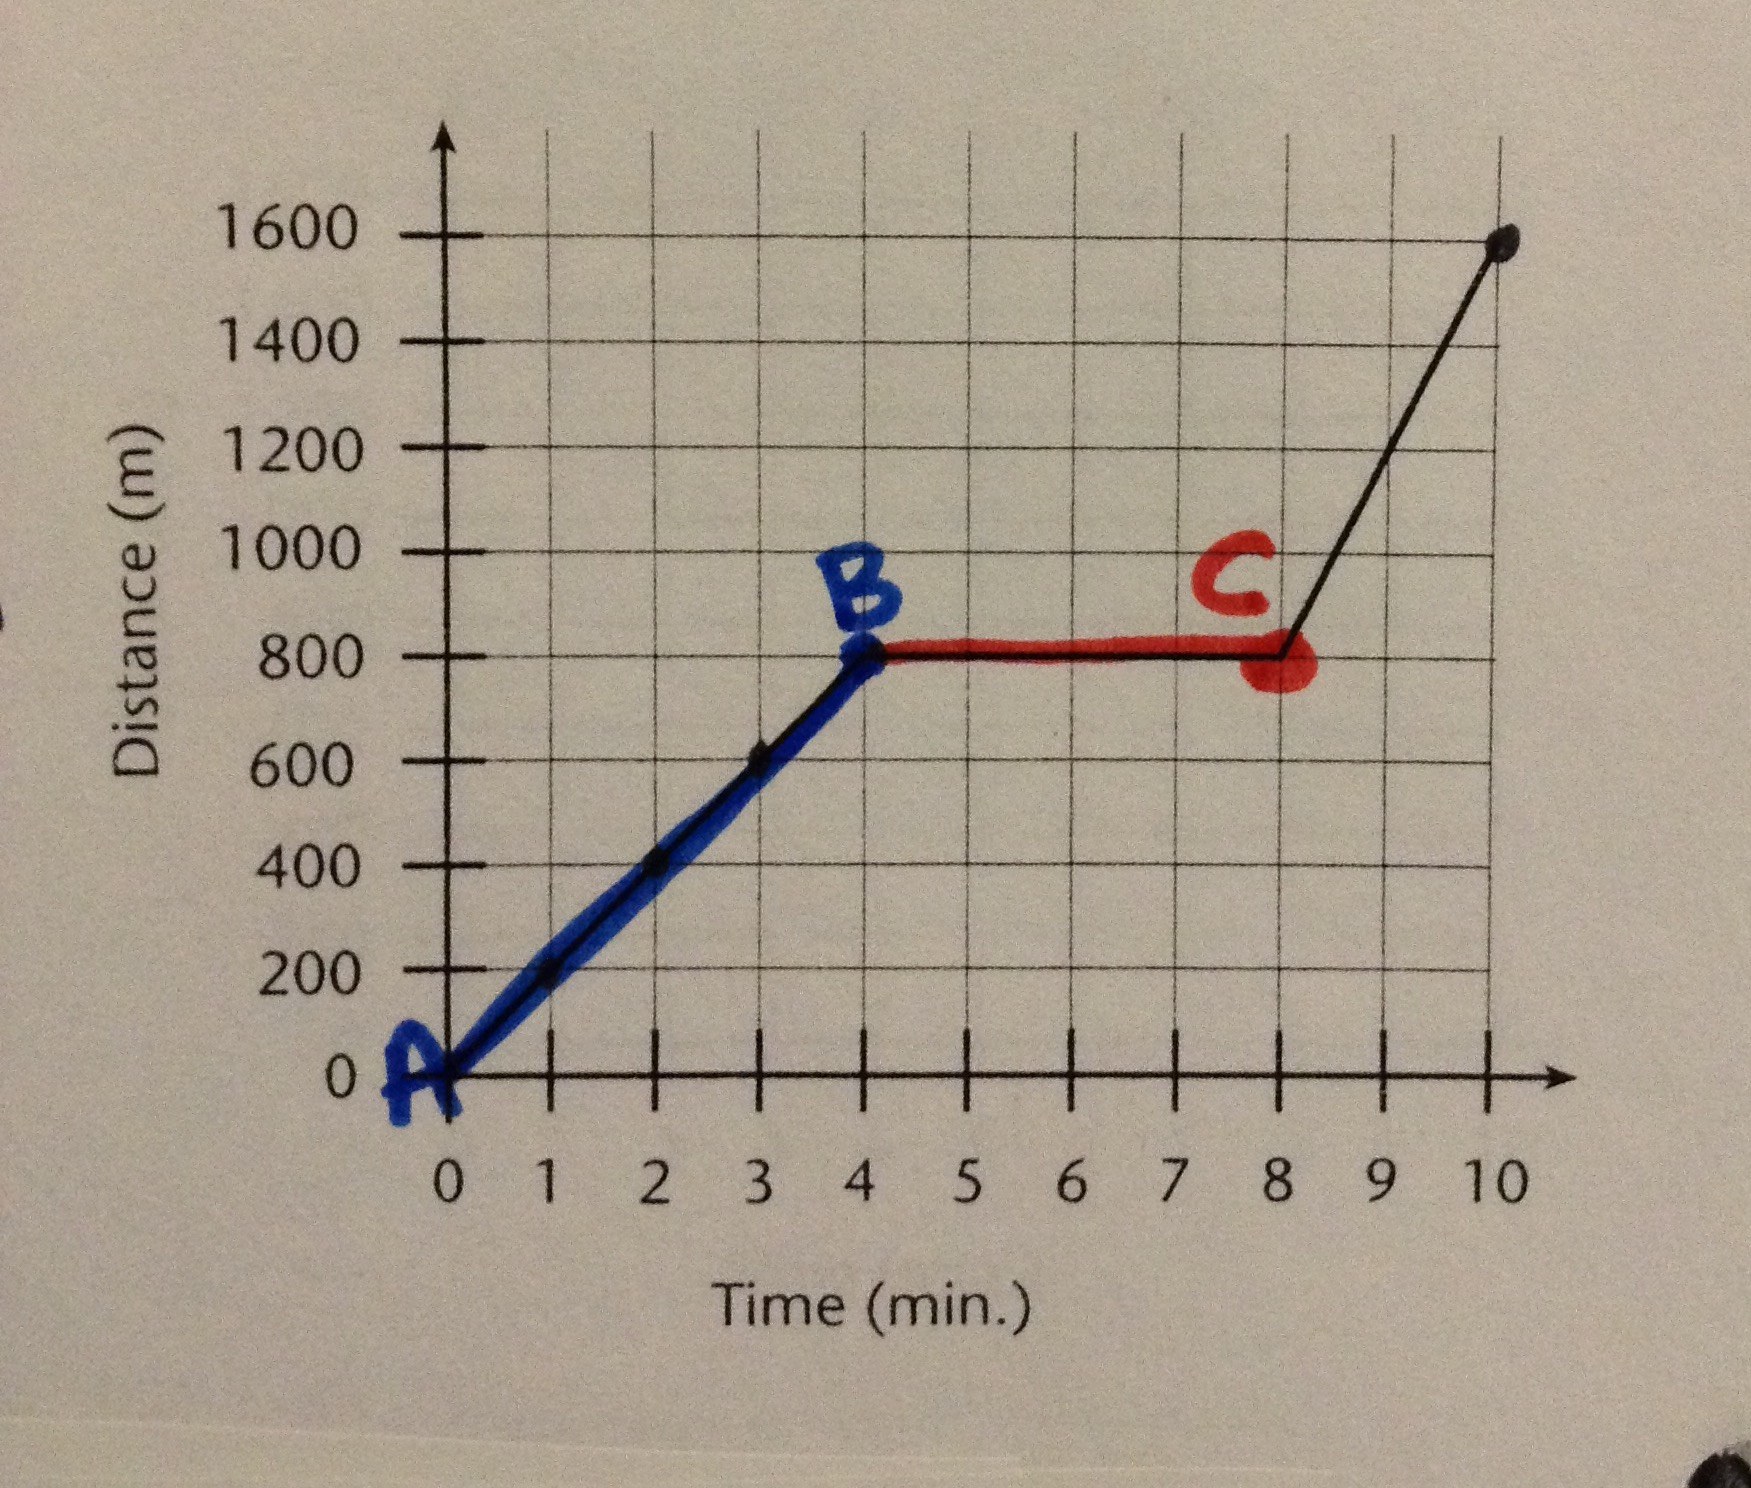
What was occurring from point B to point C?

