

Wayground logo

Free Printable Worksheets

Font size

S
M
L
XL
Worksheets

BIO330 Tutorial 2 Population Ecology

Total questions: 21

Worksheet time: 5hrs 15mins

Name
Class
Date
1.

Select the subfield of ecology that examines species interactions, such as predation and competition.

a)

Global ecology

b)

Population ecology

c)

Community ecology

d)

Landscape ecology

2.

Name the pattern of dispersion that shows the antagonistics social interactions such as the defense of a bounded physical space against encroachment by other individuals.

a)

Clumped dispersion

b)

Uniform dispersion

c)

Random dispersion

d)

Aggregated dispersion

3.

Identify the false statement of Type III survivorship curve.

a)

Very high death rate for the young

b)

Few individuals survive at certain age

c)

Produce a large number of offspring with little care

d)

Mortality rate increases for the older group.

4.

Identify the correct term for "sample of water from Bera Lake water had 5 million diatoms of species Eunotia gracilis per cubic meter'

a)

Density

b)

Dispersion

c)

Carrying capacity

d)

Quadrats

5.

Identify the growth model that is limited by resources available as the population increase

a)

K-selection growth model

b)

Logistic growth model

c)

Exponential growth model

d)

r-selection growth model

6.

Indicates the statement that describes the reproductive strategies exhibited by salmon fishes.

a)

They produce thousand of small eggs at one reproductive opportunity and then die

b)

They carry out multiple reproductive cycles over the course of its lifetime but do not take great care of their offspring

c)

They carry out multiple reproductive cycles over the course of its lifetime and take great care of their offspring until maturity

d)

They produce small number of large eggs at one reproductive opportunity and then die.
7.
If the number of births in a population is the same as the number of deaths in a population, what will happen to the growth of the population?
a)
It will increase.
b)
It will decrease.
c)
It will stay the same.
d)
It will fluctuate.
8.
Largest number of individuals of a population that the environment can support...  
a)
carrying capacity
b)
population crash
c)
lag phase
d)
mutualism
9.
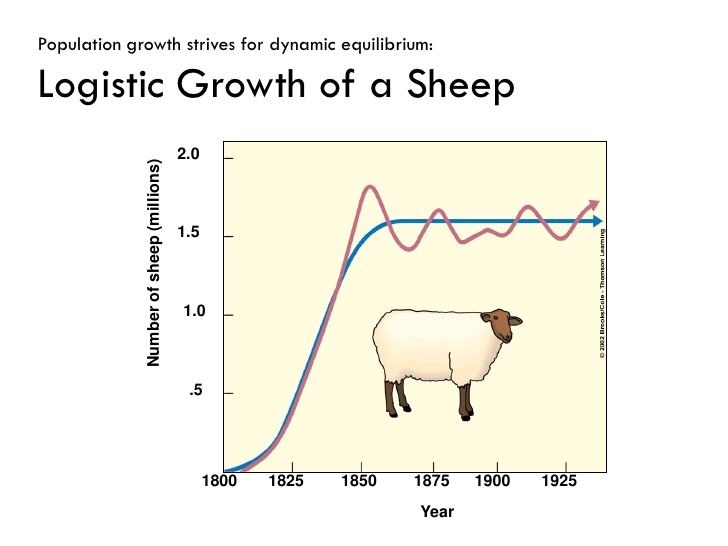
What is the carrying capacity for this sheep population?
a)
1.8 million
b)
1.25 million
c)
1.6 million
d)
1.o million
10.
When a population grows past the ecosystem's carrying capacity, what happens to the population?
a)
Continues to grow
b)
The population starts to die off to return to carrying capcity
c)
The population will go extinct due to lack of resources
d)
The population grows then finds a new carrying capacity
11.
Food, water, sunlight, shelter, and space are resources that are often __________.
a)
limiting factors
b)
wet
c)
messy
d)
found in rocks
12.
Any thing or organism that regulates the size of a population of another organism is known as __________.
a)
a limiting measure
b)
a limiting factor
c)
factorization
d)
materialization of precipitation
13.
When organisms move out of the population, this is known as
a)
emigration
b)
abandonment
c)
immigration
d)
succession
14.
In a forest ecosystem, which of the following is the best example of a limiting factor for a rabbit population?
a)
Squirrel Population
b)
Sunlight
c)
Grass available
15.
which statement sounds accurate based on the graph data. 
a)
The zebra and lions do not affect each other
b)
when lions population increases, so does the zebra population
c)
When the zebra population increases, it causes the lion population to also increase
d)
when zebra populations go down, the zebra population goes up. 
16.
What type of growth is represented behind?
a)
exponential
b)
logistics
c)
a good kind
d)
representative
17.

Which of the following are density dependent factors?

a)

competition for resources

b)

predation

c)

disease

d)

natural disasters

18.

Which of the following are examples of a density independent factors?

a)

forest fire

b)

seasonal cycles

c)

storms

d)

disease

19.

Select the correct description of life table population

a)

The curves plot the numbers in a cohort that are still alive at each age

b)

The mortality and and survival data of a population are available during their life span

c)

The average time is between the birth of an individual and the birth of its offspring

d)

The proportion of different age groups within a population are shown

20.
What do age structure diagrams look like for countries that have reached zero population growth?
a)
inverted pyramid
b)
broad-based pyramid
c)
little variation in population by age
d)
large pre-reproductive population
21.
Rapidly growing countries have an age structure diagram that
a)
forms an inverted pyramid
b)
has a broad-based pyramid
c)
shows little variation in population by age
d)
large post reproductive population