wayground logo

Free Printable Worksheets

Font size

S
M
L
XL
Worksheets

Statistics Test

Total questions: 50

Worksheet time: 1hrs 11mins

Name
Class
Date
1.
To find the average of a set of numbers, add up all the items and divide by...
a)
2
b)
The minimum
c)
The maximum
d)
The number of items
2.
At Donald's Donuts the number of donut holes in a bag can vary. Help Donald find the mode.
12,10,10,10,13,12,11,13,10
a)
13
b)
12
c)
11
d)
10
3.
What is the mode?
a)
# happening the most
b)
the average
c)
biggest - smallest
d)
the middle #
4.

The scores awarded to 25 students for an assignment were as follows:

4 7 5 9 8 6 7 7 8 5 6 9 8 5 8 7 4 7 3 6 8 9 7 6 9

What is the mode?

a)

6

b)

7

c)

8

d)

9

5.
Find the mean of these numbers:
5,11,2,12,4,2
a)
4.1
b)
6
c)
4.5
d)
4
6.
Find the median of these numbers:
4,2,7,4,3
a)
2
b)
5
c)
7
d)
4
7.
find the median of
20 30 40 50 60
a)
50
b)
40
c)
1
d)
5
8.
What is the mode in the set of data?
2,2,2,4,4,5,6,6,6,7
a)
2
b)
6
c)
2 and 6
d)
2,4, and 6
9.
Find the mean of these numbers:
2, 57, 38, 42, 6
a)
29
b)
38
c)
50
d)
145
10.
Which is the MIDDLE?
a)
Mean
b)
Median
c)
Mode
d)
Range
11.
Which is the closest to what most people would call the "average?"
a)
mean
b)
median
c)
mode
d)
range
12.
Which is the number that appears the MOST often?
a)
mean
b)
median
c)
mode
d)
range
13.
If you have two numbers in the middle, you should
a)
add them together and divide by two
b)
find the number in between the two
c)
find the mean of the two numbers
d)
all of these
14.
Four friends went shopping for school clothes. Kim bought 5 shirts, Jill bought 4 shirts, Leslie bought 6 shirts, and Crystal bought only 1 shirt. Which answer choice represents the mean of the shirts purchased?
a)
3
b)
2
c)
6
d)
4
15.
What is the median of the following numbers? 1, 2, 2, 8, 9, 14
a)
13
b)
5
c)
2
d)
6
16.
Find the mean of the data set...
16,17,18,19, 20, 24, 31, 33, 36, 62

a)
15.7
b)
27.6
c)
26.7
d)
27
17.
A data set can have more than one mode
a)
True
b)
False
18.
A data set can have more than one median?
a)
True
b)
False
19.
In order to find the median, the data must be sorted from least to greatest first.
a)
True
b)
False
20.
Which day had more minutes of homework?
a)
Wednesday
b)
Thursday
c)
Friday
d)
Ms. Jones
21.
How many students were greater than or equal to 60 inches tall?
a)
21
b)
11
c)
17
d)
6
22.
Which interval shows the greatest number of pets?
a)
15-19
b)
0-4
c)
5-9
d)
10-14
23.
Histograms are a special type of
a)
Box Plot
b)
Line Graph
c)
Bar Graph
24.

The double dot plots show the average wait times, in minutes, for two popular rides at an amusement park. Which ride typically has a longer wait time?

a)

No inference can be made from the graph.

b)

Topsy Turvy

c)

The wait times are the same for both rides.

d)

Rocket Blast

25.
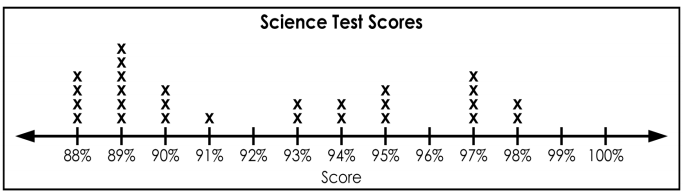
What is the highest score in the class?
a)
88%
b)
100%
c)
196%
d)
98%
26.

Terry made the dot plot above to chart the amount of time, in minutes, that it took students to eat breakfast in the morning. How many students took 5 or more minutes to eat their breakfast?

a)

11

b)

12

c)

14

d)

16

27.

What does point C on the box plot represent?

a)

First Quartile

b)

Median

c)

Third Quartile

d)

Mean

28.

What does point C on the box plot represent?

a)

First Quartile

b)

Median

c)

Third Quartile

d)

Mean

29.

What do points B and D represent on the box plot?

a)

Mean and Mode

b)

Mean and Median

c)

Least and Greatest Value

d)

First and Third Quartiles

30.

What do points A and E represent on the box plot?

a)

Mean and Mode

b)

Mean and Median

c)

Least and Greatest Value

d)

First and Third Quartiles

31.

What is the median of this data set?

a)

8

b)

12

c)

15

d)

19

32.

What is the least and greatest value of this data set?

a)

6 and 8

b)

6 and 19

c)

8 and 15

d)

15 and 19

33.

What is the range of this data set?

a)

6

b)

12

c)

13

d)

19

34.

Data points in the first quartile are between which two points?

a)

6 and 8

b)

8 and 12

c)

12 and 15

d)

15 and 19

35.

What is the Interquartile Range of this data set? The lower (first) quartile is 19 and the upper (3rd) quartile is 56.

a)

75

b)

37

c)

72

36.

What is the Range of this data set?

a)

13

b)

37

c)

72

37.

Interquartile Range is

a)

the difference between the third quartile and the first quartile

b)

the difference between the greatest and least data values.

38.

Range is

a)

the difference between the third quartile and the first quartile

b)

the difference between the greatest and least data values.

39.

how many people voted in this dot plot

a)

4

b)

9

c)

3

d)

not here

40.
How many students received a score in the 90s?
a)
6
b)
2
c)
91%
d)
17
41.
How many total students are in the science class?
a)
13
b)
6
c)
27
d)
25
42.
How many people have two or less books in their desk?
a)
4
b)
5
c)
6
d)
7
43.
What type of graph is this?
a)
Bar Graph
b)
Histogram
c)
Line Plot
44.
What is the least value?
a)
52
b)
0
c)
13
d)
10
45.
How many people watched more than 6 hours of TV?
a)
10
b)
5
c)
20
d)
17
46.
Which interval has 400 employees?
a)
33-43
b)
0-10
c)
77-87
d)
66-76
47.
How many students scored between a 86 and a 90?
a)
1
b)
3
c)
6
d)
10
48.
Is this an example of a histogram?
a)
yes
b)
no
49.
This is a histogram
a)
true
b)
false
50.
What is incorrect about the following histogram?
a)
The intervals are too small
b)
The intervals overlap
c)
The graph does not start at 0
d)
The axes are not labeled.