
 Worksheets
Algebra I EOC Review
Total questions: 164
Worksheet time: 9hrs 12mins


1.5
45
30
46.5

A
B
C
D

A
B
C
D

A
B
C
D

A
B
C
D

A
B
C
D

A
B
C
D

A
B
C
D

A
B
C
D

F
G
H
J

A
B
C
D

A
B
C
D

F
G
H
J

Simplify (4x2−6x+3)−(7x2−9x−1)
- −3x2−3x−4
−3x2−3x+4
−3x2+3x−4
−3x2+3x+4
2x2−13x+15
2x2−7x+15
2x2+7x+15
2x2+7x−15

Left/Negatively Skewed
Right/Positively Skewed


8y < (-40)

roots
solutions


11, 22, 44, 88...
2, -6, 18, - 54...


(-3, -4) & (7, 6)?


5x - 3y = -9
(-3, -4) & (7, 6)?
6 - (8 - 4n) = 2(2n - 1)
4 - 5x < 22 - 2x

(8,10), (3, -4), (0, 8), (4, -3), (9, 0)


I. {(1, 4), (2, 5), (3, 6)}
II. {(1, 4), (2, 4), (3, 4)}
III. {(1, 4), (2, 4), (1, 3)}
IV. {(1, 4), (1, 2), (1, 3)}
Which expression is equivalent to
6x2 + 13x + 5
(2x + 5)(3x - 1)
(2x - 5)(3x + 1)
(2x + 1)(3x + 5)
(2x - 1)(3x - 5)
Which expression is equivalent to
m2 - 13m - 30
(m - 15)(m + 2)
(m - 10)(m - 3)
(m + 15)(m - 2)
(m + 10)(m + 3)

The graph models the linear relationship between Earth's atmosphere and the altitude above sea level.
Which of these best represents the rate of change of the temperature with respect to the altitude?
-6.5* C/km
-3.5* C/km
-0.29* C/km
-0.15* C/km

The graph shows the relationship between the number of cookies a presenter at a convention had left to give away and the number of presentations she had made.
What does the y-intercept represent?
The number of cookies the presenter had before making any presentations.
The maximum number of cookies the presenter gave away during every presentation.
The number of presentations the presenter made per hour.
The maximum number of presentations the presenter made before running out of cookies.

The graph of line t is shown on the grid.
Line w is steeper than line t and has a y-intercept that is below the y-intercept of line t. Which function could be represented by line w?
y = -2/3x - 1
y = -3/8x + 4
y = -4/3x + 4
y = -1/4x - 1
Which graph represents -3x + 5y = -15


The mapping represents all of the points on the graph of function f.
What is the domain of f?
{-4, -1, 0, 2, 7}
{-5, -4, -1, 0, 1, 2, 4, 7}
{-5, 0, 1, 2, 4}
{7}

The table represents some points on the graph of a linear function.
What function represents the same relationship?
h(x) = -x - 3.5
h(x) = -3x - 10.5
h(x) = 3x - 10.5
h(x) = x - 3.5
Researchers in Antarctica discovered a warm sea current under a glacier that is causing the glacier to melt. The ice shelf of the glacier had a thickness of approximately 450 meters when it was first discovered. The thickness of the ice shelf is decreasing at an average rate of 0.06 m per day.
Which function can be used to find the thickness of the ice shelf in meters x days since the discovery?
f(x) = 450 - 0.06x
f(x) = -0.06(x + 450)
f(x) = 450 + 0.06x
f(x) = 0.06(x + 450)
A college student needs 11 classes that are worth a total of 40 credits in order to complete her degree. The college offers both 4-credit classes and 3-credit classes. Which system of equations can be used to determine f, the number of 4-credit classes the student can take to complete her degree, and h, the number of 3-credit classes?
f + h = 40
4h + 3f = 11
f + h = 11
4h + 3f = 40
f + h = 40
4f + 3h = 11
f + h = 11
4f + 3h = 40

The graphs of lines k1 and k2 are shown on the grid.
Which system of equations is best represented by this graph?
3x - y = 2
4x + 9y = 36
3x - y = 6
4x + 9y = 4
x - 3y = -18
9x + 4y = 9
x + y = 10
9x + 4y = 13
There are 156 laptops and desktop computers in a lab. There are 8 more laptops than desktop computers. What is the total number of laptops in the lab?
74
86
82
70
What is the solution to
0.3(12x - 16) = 0.4(12 - 3x) ?
-2
4
2
-4
What is the solution to
8x - 3(2x - 4) = 3(x - 6) ?
6
2
30
No Solution

The table shows some ordered pairs that belong to the quadratic function h.
What is the range of h?
All real numbers
All real numbers greater than or equal to -7
All real numbers greater than or equal to -8
All real numbers greater than or equal to 0
Which graph best represents a function with a range of all real numbers less than or equal to -6?


The graph of f(x) = 6x2 - 11x + 3 is shown on the grid.
What are the zeros of f.
3
2 and 9
11/12
1/3 and 3/2

The graph of a quadratic function is shown on the grid.
Which equation best represents the axis of symmetry?
y = 6
x = 2
y = 4
x = 0
Function p is in the form y = ax2 + c. If the values of a and c are both less than 0, which graph could represent p?


The graph of f(x) = x2 was transformed to create the graph of g(x) = (x - 7.5)2. Which of these describes the transformation?
A horizontal shift to the right 7.5 units.
A horizontal shift to the left 7.5 units.
A vertical shift down 56.25 units.
A vertical shift up 56.25 units.
The total number of seats in an auditorium is modeled by f(x) = 2x2 - 6x, where x represents the number of rows of seats. How many rows are there in the auditorium if it has a total of 416 seats?
32
13
20
16
A particular type of cell doubles in number every hour. Which function can be used to find the number of cells present at the end of h hours if there were initially 4 of these cells?


The amount of fertilizer in a landscaping company's warehouse decreases at a rate of 3% per week. The amount of fertilizer in the warehouse was initially 78,000 cubic yards.
Which function models the amount of fertilizer in cubic yards left after w weeks?
f(w) = 0.97(78,000)w
f(w) = 1.03(78,000)w
f(w) = 78,000(0.97)w
f(w) = 78,000(1.03)w

The graph of an exponential function is shown on the grid.
Which dashed line is an asymptote for the function?
Line q
Line r
Line s
Line t
Which statement about the graph of y = ⅓(⅔)x is true?
The graph has a vertical asymptote.
The graph crosses the y-axis at (0, 2/9).
The graph has an asymptote at y = ⅓.
The graph decreases from left to right.
Solve the inequality below:
−5−(14x−1)<2(7x−16)
x<−1
x>1
x>−4
x≤3
Which expression is equivalent to 210d2−63d ?
21d(10d−3)
21d(10d+3)
21(10d+3)
21(10d−3)
Solve the inequality below:
6(x−5)>3(x−1)
x>9
x>11
x<11
x>−9
What value of x makes the equation −5x−(−7−4x)=−2(3x−4) true?
x=51
x=31
x=3
x=5
What are the solutions to the equation
3x2+5x=18 ?
x=−6 and x=1
x=−3 and x=−2
x=6 and x=13
x=0 and x=1
Which expression is equivalent to 2x2+(4x−6x2)+9−(6x+3) ?
−4x2−2x+6
−10x+6
18x+12
−4x2−2x+12
Which expression is equivalent to 6x2−13x+5
(3x−5)(2x−1)
(3x−1)(2x+5)
(3x−1)(2x−5)
(3x−5)(2x+1)
Which expression is equivalent to −6x2−11x−4 ?
(−3x−4)(2x+1)
(3x−7)(3x+3)
(−3x+4)(2x−1)
(3x+7)(3x−3)
8x - 10 = -34
3(x - 2) = 18

What is the y-intercept in the equation? y=−32 x+8
2
−32
-8
3


3x + 8y = 24

2n2-8n3
Factor:
3p2 - 15p
p(p - 15)
3p(p - 3)
p2(3-15)
3p(p - 5)
5a + 2b - 3a + 4
-7y+63
-9(14p - 8) - 4p

√200
√45
√96
Calculate the MEAN for the data set: 6, 7, 12, 8, 7, 4, 8, 8, 7
7
7.44
8
7 and 8
Calculate the MEDIAN for the data set: 6, 7, 12, 8, 7, 4, 8, 8, 7
7
7.44
8
7 and 8
Calculate the MODE for the data set: 6, 7, 12, 8, 7, 4, 8, 8, 7
7
7.44
8
7 and 8
Calculate the RANGE for the data set: 6, 7, 12, 8, 7, 4, 8, 8, 7
7
7.44
8
7 and 8
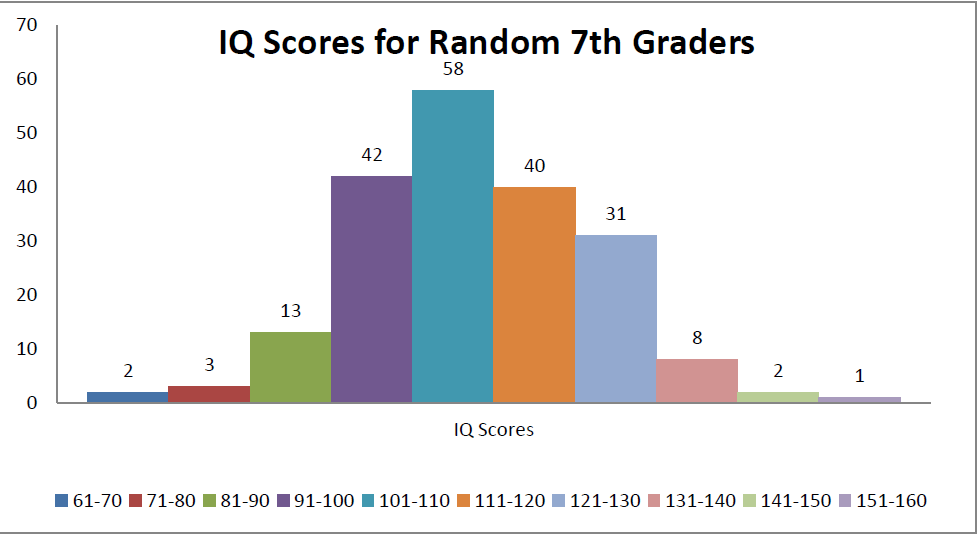
How many 7th graders had an IQ score in the 81-90 range?
13
6.5
3
42
What was the most common IQ range?
91-100
111-120
12-130
101-110

Calculate the 5 number summary for the following data. You may use your graphing calculator.
1791, 3162, 6163, 8578, 9400
1791, 3815, 6472, 8924.5, 9400
6197.44
7609
Find the Inter-Quartile Range (IQR). You may use your graphing calculator.
7609
8924.5
2708
5416

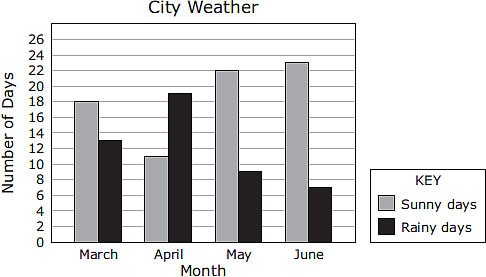
Based on the graph,how many more sunny days than rainy days did this city have during the months of April, May, and June?


Which measure of central tendency would best represent this data?
Mean
Median
Mode
Range

Which measure of central tendency best represents this data?
Mean
Median
Mode
Range

What is the Mean Absolute Deviation (M.A.D.) for this data?
14, 19, 26, 27, 39
125
6.8
25
34

What 3 values could be entered for Wednesday, Thursday, Friday to give you a MEAN of 7?
9,6,9
2,3,5
Any 3 numbers that add up to 20.
All sevens
If there is an outlier in your data (a point very far from the other data, or a very long whisker), what is the best measure of center to use and why?
Median is best because the outlier skews the data.
Mean is best because the outlier doesn't skew the data.
Mode is always the best measure of center because it shows the most.
What is the first step to solving for the Mean Absolute Deviation?
Find the mean of the new set of numbers
Find the mean of the given data set
Subtract the mean from each original data point
What is the second step to solving for the Mean Absolute Deviation?
Find the mean of the new set of numbers
Find the mean of the given data set
Subtract the mean from each original data point
What is the last step to solving for the Mean Absolute Deviation?
(Practice doing this WITHOUT the MAD button on the Desmos Calculator since you will not have access to it during the EOC)
Find the mean of the new set of numbers
Find the mean of the given data set
Subtract the mean from each original data point
Find the Mean Absolute Deviation of the set: 10, 5, 7, 14, 19, 32, 25
(Practice doing this WITHOUT the MAD button on the Desmos Calculator since you will not have access to it during the EOC)
8
16
56
112
Find the Mean Absolute Deviation of the set: 56, 21, 55, 30, 34
(Practice doing this WITHOUT the MAD button on the Desmos Calculator since you will not have access to it during the EOC)
39.2
13.04
196
65.2

