
 Worksheets
Mat 143 Statistics
Total questions: 166
Worksheet time: 8hrs 57mins
What is the range?
smallest-biggest
highest score - lowest score
the middle #
# happening the most
To find the average or mean of a set of numbers, add up all the items and divide by...
2
The minimum
The maximum
The number of scores
What is the mean of this set of data?
2, 15, 7
24
3
6
8
5, 15, 10, 20, 15, 10, 15

12,10,10,10,13,12,11,13,10

Dr. Dre is a dentist. He needs to report on the average number of cavities that his patients have. In one day he records the following number of cavities: 1,0,1,5,6,3,4.
What should he report?
3.33
2.85
3
3.5
2, 3, 4, 5, 5, 7
9, 8, 12, 6, 10
What is the mean number of pages she wrote per day?
Find the median, mode and range:
3, 5, 7, 9, 11, 8, 3
median:7 mode:9 range:8
median:6 mode:3 range:7
median:7 mode:3 range:8
33, 25, 42, 25, 31, 37, 46, 29, 38
What is the upper (/3rd) quartile of the data?
37
38
40
46
33, 25, 42, 25, 31, 37, 46, 29, 38
What is the lower (1st) quartile of the data?
25
27
29
33
33, 25, 42, 25, 31, 37, 46, 29, 38
What is the interquartile range (IQR) of the data?
8
9
13
21
33, 25, 42, 25, 31, 37, 46, 29, 38
What is the interquartile range (IQR) of the data?
8
9
13
21

How many data points are greater than 34?
10
11
12
13

Calculate the 5 number summary for the following data. You may use your graphing calculator.
1791, 3162, 6163, 8578, 9400
1791, 3815, 6472, 8924.5, 9400
6197.44
7609
Find the Inter-Quartile Range (IQR). You may use your graphing calculator.
7609
8924.5
2708
5416
Owen was asked to write down the number of pull-ups that 7 of his classmates could do. He wrote down: 3, 2, high, low, 6, 1, 8. Owen said that "high" was greater than 6 and "low" was less than 2. Find the median.
2
3
2.5
Cannot be determined.
On a recent test, one class of 26 students had a mean score of 78%, while another class of 32 students had a mean score of 86%. What is the overall mean of the two classes combined?
82
82.4
81
83
Find the mode:
3.8, 4.2, 4.0, 4.2, 4.2
4.2
3.8
4.0
4




Marco bowled 7 games last weekend. His scores are: 155, 165, 138, 172, 127, 193, 142. What is the range of Marco's scores?
193
127
60
66


What test score is the mode of Mary's data?
49
55
85
73


Describe the shape of the graph.
Skewed right
Skewed left
Random
Symmetrical
At an assembly 7 out of 10 students who entered the gym were carrying a backpack. Based on this information, if 700 students were at the assembly, how many students could be expected to be carrying a backpack?
49
490
210
421
A public library asked every 10th person who entered to name the type of book they were getting
Biased
Unbiased

The Student Council asked every tenth student in the lunch line how they preferred to be contacted with school news. The results are shown in the table. Is this an unbiased sample? If yes, suppose there are 684 students at the school. How many can be expected to prefer E-mail?
No, it's a biased sample
432
304
16
A hospital wants to open a gym. They ask the night-shift ER staff when they would use the gym.
Biased
Unbiased
A radio station asks its listeners to dial one of two numbers to indicate their preference for one of two candidates in an upcoming election. Of the responses received, 76% favored candidate A. If there are 1,500 registered voters, how many will vote for candidate A?
1,140
6
1,974
100
To determine the number of umbrellas the average household in the United States owns, a survey of 100 randomly selected households in Arizona is conducted. Of the households, 24 said that they own 3 or more umbrellas. The researcher concluded that 24% of the households in the United States own 3 or more umbrellas. Is the this a valid conclusion? Justify your answer.
Valid. The sample is biased.
Not valid. The sample is biased.
Valid. The sample is unbiased.
Not valid. The sample is unbiased.
A company makes DVDs and randomly selects 25 from 1500 to test them to see if they work.
Biased
Unbiased

Which measure of central tendency would best represent this data?
Mean
Median
Mode
Range

Which measure of central tendency best represents this data?
Mean
Median
Mode
Range
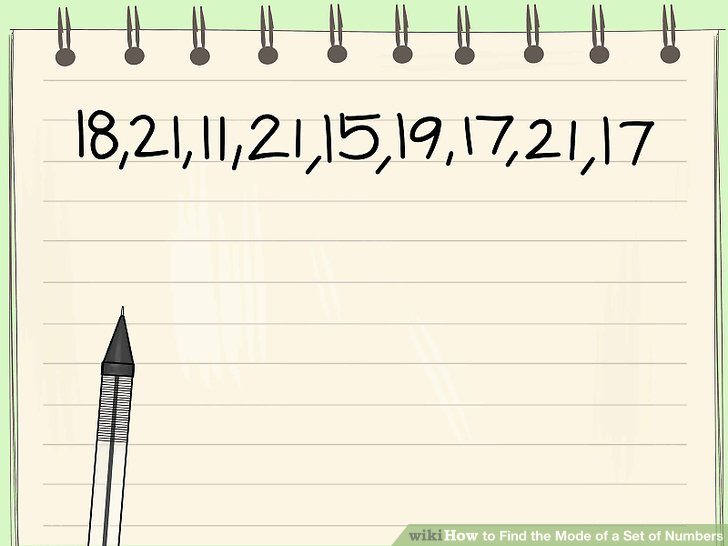
The mean of this data set is 17.8. What would happen to the mean if 40 was added to the data set?
The mean would not change
The mean would go up
The mean would go down
What is the first step when creating a box and whisker plot?
Find the median
Find the lowest and highest values
Order the data set
Find the median of the top and bottom halves

Which class has the higher median?
1st period
2nd period
They have the same median

Which class did better on the test?
1st period
2nd period
They both performed the same

How is the data distributed in this histogram?
Symmetrically
Skewed Right
Skewed Left

How is the data distributed in this histogram?
Symmetrically
Skewed Right
Skewed Left
What does the standard deviation tell us about the data set?
How spread out the numbers are
How much each number in the data set increases by
How much each number in the data set decreases by
What is normal distribution?
A symmetrical bell-shaped graph
A graph that is skewed to the right
A graph that is skewed to the left
What percent of data lies within 1 standard deviation from the mean?
95%
99%
68%
100%


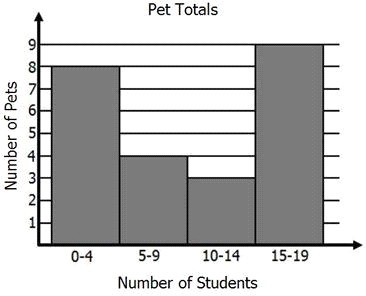
How many kids have dogs and cats for pets?



According to this article, what is STATISTICS?
Statistics is the universal language of the sciences that involves information, numbers, visual graphics to summarize information and its interpretation. In other words, the science of collecting, describing, and interpreting data.
Statistics is a method of analyzing and collecting data that is not easily visible and must be described by using mathematics and other sciences.
Statistics is using data, concluding data and making inferential theories from the information that has a positive normal distribution.
Statistics involves using information, numbers, and descriptive conclusions to help businesses make corrective business decisions based on the descriptive techniques that create perfect graphs.
Descriptive statistics involves...
collection, presentation, and description of sample data
the technique of interpreting the values resulting from the descriptive techniques and making decisions and drawing conclusions about the population
attempting to provide incorrect information and provide misleading graphs
using information, numbers, and graphics even when data can't be collected
Inferential statistics involves...
collection, presentation, and description of sample data
the technique of interpreting the values resulting from the descriptive techniques and making decisions and drawing conclusions about the population
attempting to provide incorrect information and provide misleading graphs
using information, numbers, and graphics even when data can't be collected
Careful use of statistical methods does not include....
carefully defining the situation
gathering data
summarizing the data accurately
deriving and communicating meaningful conclusions
throwing out data that does not fit the graph
What is not a usual question to ask when conducting statistical analysis?
If the data does not give me the results I want do I still trust the results?
Where did the data come from, what is its source?
What kind of surveys were conducted, if any?
Are the results of the data reliable?
Statistics are used...
in education
in science
in government
in mathematics
all of the answer choices
The POPULATION in statistics is best described by...
a collection, or set, of individuals, objects, or events whose properties are to be analyzed
the total number of people that live in a particular city
the incomplete collection of individuals or objects that are of interest to the sample collector
a collection of people that are being analyzed for membership on a list of particular elements to be studied
A finite population is one that...
can be physically listed
the membership in the population is unlimited
ends abruptly due to a catastrophy
ends abruptly due to natural causes, such as a flood or the ice age
An infinite population is one that...
can be physically listed
the membership in the population is unlimited
ends abruptly due to artificial intervention, such as treating with an antibiotic
ends abruptly due to natural causes, such as a flood or the ice age
A sample is...
a subset of a population
an infinite selection of a population
a characteristic of a population
a data value generated by the statistical information
A variable (or response variable) is
a characteristic of interest about each individual element of a population or sample
a characteristic that is irrelevant to the collection of the data
a characteristic that changes when the data is collected
a characteristic or trait that will be ignored in a sample population
An experiment is...
a planned activity whose results yield a set of data
a numerical value that summarizes all of the data of an entire population
the set of values collected from the variable from each of the elements that belong to the sample
A numerical value summarizing the sample data
A parameter is...
a planned activity whose results yield a set of data
a numerical value that summarizes all of the data of an entire population
the set of values collected from the variable from each of the elements that belong to the sample
A numerical value summarizing the sample data
A statistic is...
a planned activity whose results yield a set of data
a numerical value that summarizes all of the data of an entire population
the set of values collected from the variable from each of the elements that belong to the sample
A numerical value summarizing the sample data
Data is...
a planned activity whose results yield a set of data
a numerical value that summarizes all of the data of an entire population
the set of values collected from the variable from each of the elements that belong to the sample
A numerical value summarizing the sample data
Which of the following statements about variables is correctly paired?
A qualitative variable describes or categorizes an element of population, while a quantitative variable quantifies an element of a population
A quantitative variable describes or categorizes an element of population, while a qualitative variable quantifies an element of a population
A qualitative variable describes an element of the sample population, while a quantitative variable quantifies an element of total population
A quantitative variable describes an element of the sample population, while a qualitative variable quantifies an element of total population
A nominal variable...
is a qualitative variable that characterizes, describes, or names an element of a population
is a qualitative variable that incorporates an ordered position, or ranking
a quantitative variable that can assume a countable number of values, in other words, there is a gap between any two values
a quantitative variable that can assume an uncountable number of values, in other words, it includes every possible value between any two values
An ordinal variable...
is a qualitative variable that characterizes, describes, or names an element of a population
is a qualitative variable that incorporates an ordered position, or ranking
a quantitative variable that can assume a countable number of values, in other words, there is a gap between any two values
a quantitative variable that can assume an uncountable number of values, in other words, it includes every possible value between any two values
A discrete variable...
is a qualitative variable that characterizes, describes, or names an element of a population
is a qualitative variable that incorporates an ordered position, or ranking
a quantitative variable that can assume a countable number of values, in other words, there is a gap between any two values
a quantitative variable that can assume an uncountable number of values, in other words, it includes every possible value between any two values
A continuous variable...
is a qualitative variable that characterizes, describes, or names an element of a population
is a qualitative variable that incorporates an ordered position, or ranking
a quantitative variable that can assume a countable number of values, in other words, there is a gap between any two values
a quantitative variable that can assume an uncountable number of values, in other words, it includes every possible value between any two values
1, 3, 4, 4, 5, 6, 7

(draw a line down the middle and both sides look the same)
(draw a line down the middle and both sides look the same)
(draw a line down the middle and both sides look the same)


What percent of people are 3 standard deviations above the mean?
.15
34
68
2.35
What percent of people within 1 standard deviation of the mean?
99.7
34
68
95


23, 34, 27, 7, 30, 26, 28, 31, 34


This graph is
Symmetric
Skewed to the left
Skewed to the right
Incorrect

What is the upper quartile(Q3) for both 1st Period and 2nd Period?
80, 85
90, 85
100, 95
90, 92

What is the interquartile range of 2nd Periods test scores?
12
9
15
80


Mrs. Spencer made scatterplot to show the relationship between the number of absences and a student’s final exam score. Based on this scatterplot, a student with 6 absences should get approximately what score on the final exam?
65
92
70
76


The scatter plot below shows the number of books read by students in Mrs. Kenyon’s English class and their final grades. Which statement represents the best description about the line of best fit?
The more books students read, the lower their English grade.
The more books students read, the higher their English grade.
The fewer books students read, the higher their English grade.
No relationship exists between the number of books students read and their English grades.

y=0.5x+10
What does the slope of the graph of this equation represent?
These kind of observation use your senses to observe results.
qualitative
quantitative
There were 4 fewer drops on the penny dipped in soap than the one dipped in oil.
qualitative
quantitative
both
neither
There are 3 more blue beads than red beads.
qualitative
quantitative
both
neither

There are 75 trees in the forest.
qualitative
quantitative
The leaves on the plant are turning brown.
qualitative
quantitative
both
neither
The plant has grown 4 cm since yesterday.
qualitative
quantitative
both
neither
A condition that occurs when data points in a scatter plot are grouped more in one part of the graph than the other.
Clustering
Cluster
Gap
Outlier


Which statement about the medians is true?
Which statement about the data is NOT true?


Mai drew two box plots to show the scores for two groups of friends who went bowling. Which group shows greater variability?
The first group shows greater variability because it has a wider range (120) and a wider IQR (50).
The second group shows greater variability because there is a longer bottom whisker.
The groups have about the same variability, but the first group had higher scores overall.

This box plot displays information about the number of text messages some students sent one day. Is this data set symmetric? Explain how you know.
Yes. It is equal on both sides of the median.
Yes. The whiskers are the same width.
No. The bottom quartile is much wider than the top one.
No. The top quartile is much wider than the bottom quartile.

The air quality was tested in many office buildings in two cities. The results of the testing is shown in these box plots. A level of less than 50 parts per million is considered healthy. A level of 50 or more parts per million is considered unhealthy.
Select all the statements that must be true.
The lowest recorded measurement was in city Q.
All buildings tested in city P are in the healthy range.
The mean for city P is greater than the mean for city Q.
The range for city Q is greater than the range for city P.
The median for city P is greater than the median for city Q.

Here’s a dot plot of a data set. Which statement is true about the mean of the data set?
The mean is less than 5.
The mean is equal to 5.
The mean is greater than 5.
There is not enough information to determine the mean.
Select all the true statements.
Given a box plot, it is always possible to calculate the mean of the data.
Given a box plot, it is always possible to calculate the median of the data.
Given a box plot, it is always possible to construct a corresponding dot plot.
Given a dot plot, it is always possible to construct a corresponding box plot.
Given a histogram, it is always possible to construct a corresponding box plot.

Jada asked some students at her school how many hours they spent watching television last week, to the nearest hour. Here is a histogram for the data she collected. About how many students did Jada ask?
30
40
100
15

What is the shape of this bar graph?
Skew right
Skew left
Symmetrical
uniform


Carrie is comparing the growth of plants under natural and artificial light sources.
Part B Use the box plots to make an inference using the variability of the data.
On average group Q has a greater growth of plants under natural and artificial light sources.
The sets have the same variability related to the growth of plants under natural and artificial light sources.

Carrie is comparing the growth of plants under natural and artificial light sources.
Part A Use the measures of center from the box plots to make an inference about the data.
On average group Q has a greater growth of plants under natural and artificial light sources.
The sets have the same variability related to the growth of plants under natural and artificial light sources.

Andy is comparing how long two tablets can be used after being fully charged.Use the measures of center to make an inference about the data.
The IQR for tablet A is higher so tablet A's battery life is more consistent.
The MAD is lower in tablet B's battery life so Tablet B is more consistent.
On average Tablet A's battery will last longer.
On average Tablet B's battery will last longer.
Andy is comparing how long two tablets can be used after being fully charged.Use the measures of variability to make an inference about the data.
The IQR for tablet A is higher so tablet A's battery life is more consistent.
The MAD is lower in tablet B's battery life so Tablet B is more consistent.
On average Tablet A's battery will last longer.
On average Tablet B's battery will last longer.
What is the upper and lower quartile?
upper quartile is the highest number and the lower quartile is the lowest number
upper quartile is the lowest number and the lower quartile is the highest number
upper quartile is the median of the upper set of data and the lower quartile is the median of the lower set of data
upper quartile is the median of the lower set of data and the lower quartile is the median of the upper set of data
What is the upper and lower extreme?
upper extreme is the highest number and the lower extreme is the lowest number
upper extreme is the lowest number and the lower extreme is the highest number
upper extreme is the median of the upper set of data and the lower extreme is the median of the lower set of data
upper extreme is the median of the lower set of data and the lower extreme is the median of the upper set of data

