
 Worksheets
**QUIZ** Stats
Total questions: 25
Worksheet time: 19mins
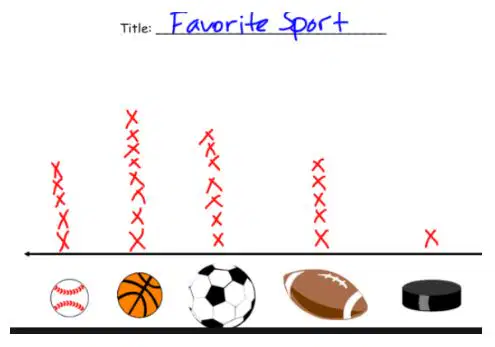
Looking at the Dot Plot, how many sports received fewer than 6 votes?
(Sample answer: 1)
(a)
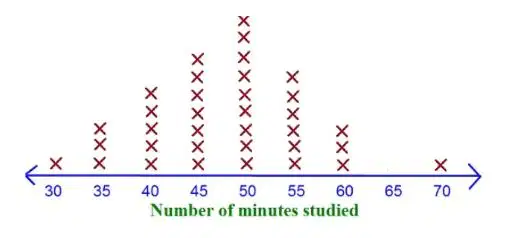
According to the data from the Dot Plot, how many students studied for at least 50 minutes?
(a)

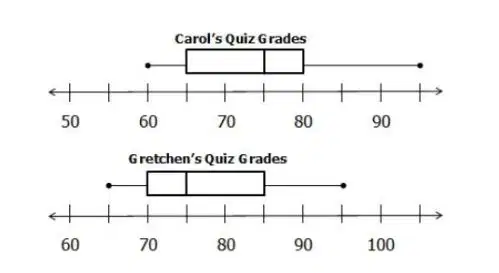
According to the Box Plots, what are some of the differences between Carol's and Gretchen's Quiz Grades? (Select all that apply)
The Range of Carol's and Gretchen's Scores
The Median of Carol's and Gretchen's Scores
The Q3 of Carol's and Gretchen's Scores
The Q1 of Carol's and Gretchen's Scores
The IQR of Carol's and Gretchen's Scores
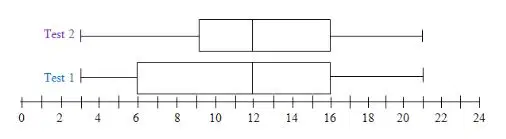
Looking at the Box Plots, what is the IQR for Test 1?
(Sample answer: 5)
(a)

What does point E on the box plot represent?
(Spelling counts!)
(a)

Which plot has a Median of 38 AND a Maximum of 100?
Plot 1
Plot 2
Plot 3
Plot 4

What is the total frequency (**NOT Relative Frequency**) of students who speak Arabic & German (combined total)?
(Sample Answer: 20)
(a)

What is the relative frequency of students speaking Vietnamese?
(Sample answer: 25%)
(a)
What is the difference in relative frequencies of students who speak German and Spanish?
(Sample answer: 25%)
(a)
Using the link below, looking at the first 32 Quarterbacks only, what is the exact value of the Range for Pass Yards?
https://www.espn.com/nfl/stats/player
(Sample answer: 1500)
(a)
Using the link below, looking at THE FIRST 32 QUARTERBACKS ONLY, match the following players and their Quartile Ranks for TD's. (Hint: Think about what each Quartile Rank means. Does Q1 represent the higher or lower numbers? Does Q4 represent the higher or lower numbers?)
1st Quartile
Brock Purdy
2nd Quartile
Daniel Jones
3rd Quartile
Jalen Hurts
4th Quartile
Kirk Cousins
Using the link below, looking at THE FIRST 32 QUARTERBACKS ONLY, what is the Mode for Sacks?
https://www.espn.com/nfl/stats/player
(If there's a tie for Sacks, select all of the numbers that apply)
55
38
33
26
27
Using the link below, what two teams would you find the Median in between for the category Free-Throw Percentage (FT%)?
https://www.nba.com/stats/teams/traditional?SeasonType=Regular+Season
(Answer contains TWO teams)
Toronto Raptors
Washington Wizards
Orlando Magic
Utah Jazz
Using the link below, which team would represent Quartile 1 (Q1) for the category Rebounds (REB)?
https://www.nba.com/stats/teams/traditional?SeasonType=Regular+Season
Milwaukee Bucks
Washington Wizards
Denver Nuggets
Miami Heat
Using the link below, looking at THE TOP 10 TEAMS ONLY, what is the Mean for Wins (W)?
https://www.nba.com/stats/teams/traditional?SeasonType=Regular+Season
(Sample answer: 25.3 - DO NOT ROUND your answer)
(a)
Use the link below to answer the following Questions about "the percent of apartment leases by starting month"
https://www.bls.gov/spotlight/2022/housing-leases-in-the-u-s-rental-market/home.htm
(**Click on Slide #6 to analyze**)
1) The three highest % of leases occured between the months of (a) and (b) .
2) As you hover your mouse over each individual bar, the Range (in %) for ALL 12-months comes out to (c) .
3) This national holiday represents the Minimum % for new leases: (d) .
4) How many different months represented a value of greater than or equal to 7.5% for new leases: (e) .
When looking at a list of different numbers (for example: 1, 2, 3, 4, 7, 10, 12, 15, 16), what is the mathematical trick to find where the middle of the data set is?

Count how many #'s are in the Data Set, Add 1, then divide it all by 2.
If the middle value is in-between two numbers, then Add those two numbers together, and then divide by 2.
Add up all the numbers in the Data Set, then Divide by however many numbers there are in the Set.
When looking at a list of different numbers (for example: 1, 2, 3, 4, 7, 10, 12, 15, 16, 100), how do you find out the actual, literal middle number of the data set when you have an even amount of numbers to analyze?
Count how many #'s are in the Data Set, Add 1, then divide it all by 2.
If the middle value is in-between two numbers, then Add those two numbers together, and divide by 2.
Add up all the numbers in the Data Set, then Divide by however many numbers there are in the Set.
Definition: Mean
The difference between the Biggest number and Smallest number
Average. When you add all the numbers in the data set and divide it all by however many numbers there are in the set
The number in the middle of the data set
The number that repeats the most times
The difference between the Third quartile and First quartile
Definition: Median
The difference between the Biggest number and Smallest number
Average. When you add all the numbers in the data set and divide it all by however many numbers there are in the set
The number in the middle of the data set
The number that repeats the most times
The difference between the Third quartile and First quartile
Definition: Mode
The difference between the Biggest number and Smallest number
Average. When you add all the numbers in the data set and divide it all by however many numbers there are in the set
The number in the middle of the data set
The number that repeats the most times
The difference between the Third quartile and First quartile
Definition: Range
The difference between the Biggest number and Smallest number
Average. When you add all the numbers in the data set and divide it all by however many numbers there are in the set
The number in the middle of the data set
The number that repeats the most times
The difference between the Third quartile and First quartile
Definition: Interquartile Range
The difference between the Biggest number and Smallest number
Average. When you add all the numbers in the data set and divide it all by however many numbers there are in the set
The number in the middle of the data set
The number that repeats the most times
The difference between the Third quartile and First quartile
True or False: When looking at a data set, it is possible to have more than one Mode?
True
False

