
 Worksheets
6th Grade Exam Review for 4th Quarter
Total questions: 68
Worksheet time: 3hrs 52mins

Identify the outlier for the given data?
23, 34, 27, 7, 30, 26, 28, 31, 34
7
23
31
34

Your math grades are 90, 85, 0, 90, 80, 100, and 90. Which grade is the outlier?
90
0
80
100
How can an outlier affect your data?
It can cause your mean to increase or decrease
nothing happens
What is an outlier?



59,65,61,62,55
what is the mean of the time taken?
7,13,18,24,9,3,18
which score occurred most often?
100, 101, 102, 100, 101, 102, 100, 101, 102, 100
There can be more than one mode
True
False
There can be more than one mean
True
False
What is the mode of the following data set...
4 , 8 , 5 , 17 , 5 , 4 , 9 , 5 , 6 , 82
4
9
6
5
What do you do if there are two numbers in "the middle" when you are finding the median?
Pick your favorite number
They are both the median
Find the mean of the two numbers
None of the above
Which is a synonym for "average?"
median
mode
range
mean
The range of the numbers 34, 32, 12, 65, and 45 is...
11
32
53
38
What is a peak on a graph.
The highest point in a cluster.
No point at all.
The lowest point.
All of the Above.
What is a Gap?
A space in between data points
That clothing company
Two close together data points

What number is the peak?
Less than 15
50
Greater than 65
60

Describe the clusters in this distribution.
There is a cluster from 16-21.
There is no cluster because the data is all together.

Describe the gaps in the distribution.
There are no gaps in the data.
There is a gap at 2.7
There is a gap at 2.1

Describe the peak of the distribution.
There is no peak of the distribution.
There is a peak at 2.8
There is a peak at 2.4
There is a peak at 2.8

True or False: This graph has two peaks?
True
False

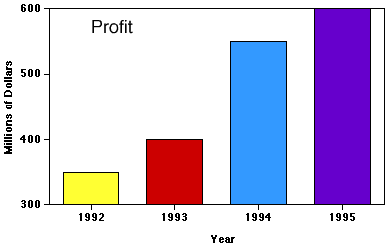
Why is this graph misleading?
x axis intervals are different
y axis intervals are different
y axis doesn't start at 0
you can't use different colors



How many people were polled in this survey?
5 people
40 people
100 people
145 people

How many students like vanilla and chocolate?
8
32
30
28

How many more students like soccer than basketball?
24
15
10
17

Which interval has the greatest number of students?


How many students have all 3 streaming services?
40
360
10
140

How many senior boys play football AND wrestle?
9
12
18
39

How many senior boys play football OR wrestle?
9
21
30
39

What is the largest number of televisions people had in their homes?
7
3
2
4

Altogether, how many people had 3 or more pets in their home?
3
7
4
11

How many students took this quiz in all?
25
0
27
16

What was the highest number of goals scored by a player?
2
10
4
6

What does point C on the box plot represent?
First Quartile
Median
Third Quartile
Mean

What do points B and D represent on the box plot?
Mean and Mode
Mean and Median
Least and Greatest Value
First and Third Quartiles

What is the least and greatest value of this data set?
6 and 8
6 and 19
8 and 15
15 and 19
What is the range of this data set?
6
12
13
19

What is the Interquartile Range of this data set? The lower (first) quartile is 19 and the upper (3rd) quartile is 56.
75
37
72
What is the Q1, Q2, and Q3 of the following data set?
4, 5, 6, 8, 9, 10, 11
Q1: 4
Q2: 8
Q3: 11
Q1: 5
Q2: 8
Q3: 10
Q1: 4
Q2: 5
Q3: 6



What is the Mode of this data?
96
97
68
802

What is the Maximum data item on this stem and leaf plot?
56%
88%
94%
8122348%

How many data items are on the plot?
16
21
22
100

What type of correlation does this graph have?
Negative
no association
positive

What type of correlation does this graph have?
positive
negative
none
all of the above

Which sentence describes the relationship shown on this scatter plot?
As the temperature decreases, the visitors increase.
As the temperature increases, the number of visitors increases.
As the visitors increase, the temperature decreases.
No correlation
What does M.A.D stand for? (a)
What is the mean absolute deviation of 13, 14, 17, 28, and 28?
Use the interquartile range to identify any outliers in the following data.
23, 22, 25, 16, 27, 43, 29, 40, 35
No outliers.
43 is an outlier.
Use the interquartile range to identify any outliers in the following data.
52, 63, 55, 56, 62, 54, 59, 60, 53, 61, 88
No outliers.
88 is an outlier.

The table shows the points earned by contestants in a competition. Find the range and the interquartile range of the points.
Range: 15
IQR: 10
Range: 15
IQR: 11
Range: 15
IQR: 12
Range: 15
IQR: 13

