wayground logo

Free Printable Worksheets

Font size

S
M
L
XL
Worksheets

Biology EOC Review - Experimental Design

Total questions: 54

Worksheet time: 3hrs 18mins
Name
Class
Date
1.
An experiment is conducted to test how different cleats change an athletes running speed.  Six different types of cleats are tested and the 100m run time is recorded.  What is the independent variable?
a)
The type of cleat
b)
The run time
c)
The 100 meters
d)
The athlete
2.
How many variables can be tested in a controlled experiment?
a)
one
b)
two
c)
three
d)
as many as possible
3.
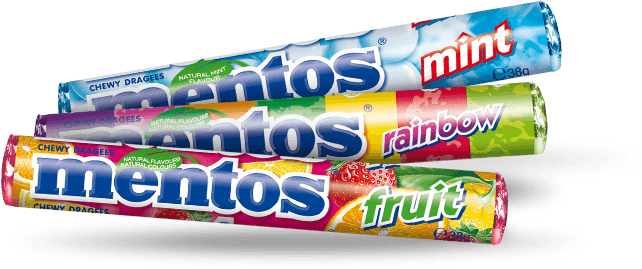
A test is set up to test which brand of soda creates the biggest foam explosion when adding a Mentos candy.  Three different sodas were tested. They measured the height of the foam eruption.   What is the dependent variable?
a)
Brand of soda
b)
Number of mentos candies used
c)
Height of foam eruption
d)
Temperature of soda
4.
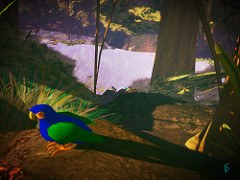
Which of the following is a quantitative observation?
a)
The bird is very colorful.
b)
The bird has 4 different colors on him.
c)
The bird has many, many feathers.
d)
It is a bird. 
5.
A student wants to test the effects of different types of exercise on heart rate.  What is the dependent variable?
a)
heart rate
b)
type of exercise
c)
amount of exercise
d)
time of day exercise occurs
6.
Research Question: Does the type of gasoline put in a car effect how fast the car can drive? What is the independent variable?
a)
Type of gasoline
b)
which car the gas is put into
c)
how fast the car can drive
d)
how much gas is put into the car
7.
This variable is the actual data collected during the experiment. 
a)
independent variable
b)
dependent variable
c)
control group
d)
data group
8.
This variable in an experiment is the one being deliberately changed by the scientist. 
a)
dependent variable
b)
independent variable
c)
data
d)
control group
9.
Things that stay the same throughout the whole experiment are called
a)
controls
b)
dependent variables
c)
independent variables
d)
constants
10.
The yard is wet so it must have rained last night is an example of a (an)
a)
constant
b)
control
c)
inference
d)
quantitative data
11.
Jane Goodall recorded 40 chimps living in a community, this is ____ data.
a)
quantitative
b)
qualitative
c)
observation
d)
field study
12.
An experiment is conducted to test which kind of cat food a cat likes best.  The amount of food the cat eats is recorded and four different type of food are tested. What is the dependent variable?
a)
The cat food
b)
The cat
c)
The amount of food the cat eats.
d)
The bowl the cat ate out of.
13.

The group that does NOT get the treatment.

a)

Control group

b)

Experimental group

c)

Constant group

d)

Independent group

14.

The group or groups that get the experimental treatment.

a)

Control group(s)

b)

Experimental group(s)

c)

Constant group(s)

d)

Dependent group(s)

15.

Look at the chart. What is the dependent variable?

a)

usual route

b)

alternate B

c)

alternate C

d)

Time in minutes

16.

Look at the chart. What is the control group?

a)

Usual route

b)

alternate B

c)

alternate C

d)

time in minutes

17.

Look at the chart. What are the independent variables?

a)

usual route

b)

alternate B

c)

alternate C

d)

time in minutes

18.

Another word for 'control group' is

a)

experimental group

b)

controlled variable

c)

data

d)

constants

19.

Constants are

a)

variables that are measured

b)

variables that are changed

c)

variables that are kept the same

20.

Based on the graph, what battery should a person use if they want the most hours of light?

a)

Duracel

b)

Energizer

c)

Panasonic

d)

All 3 batteries have equal performance.

21.
A possible explanation to a problem that has not yet been tested. 
a)
data
b)
theory
c)
hypothesis
d)
fact
22.
This variable in an experiment is the one being deliberately changed by the scientist. 
a)
dependent variable
b)
independent variable
c)
data
d)
control group
23.
Should experiments be repeated over and over to see if the results are the same each time?
a)
yes
b)
no
24.
The summary at the end of an experiment that explains the results. 
a)
conclusion
b)
procedures
c)
materials
d)
responding variable
25.
A list of the steps anyone could follow to conduct an experiment. 
a)
obervations
b)
question/problem
c)
materials
d)
procedures
26.
Which statement is an inference about this picture?
a)
The van is tan.
b)
The  van ran into KFC. 
c)
The driver was hungry. 
d)
Red and white are part of the KFC building. 
27.
Mr. S. sets up an experiment to see how the mass of a ball affects the distance it rolls off a ramp.  Identify the independent variable.
a)
distance traveled by the ball
b)
height of the ramp
c)
mass of the ball
d)
weight of the ball
28.
Mr. S. sets up an experiment to see how the mass of a ball affects the distance it rolls off a ramp.  Identify the dependent variable.
a)
height of the ramp
b)
 distance traveled by the ball
c)
mass of the ball
d)
weight of the ball
29.
When experimenting with the growth of a plant, a scientist uses three (of the same type of) plants, two different fertilizers, equal light, and equal water. What type of variable is the fertilizer?
a)
Dependent
b)
Independent
c)
Control
d)
Compound
30.
An experiment is performed on plants to see how different liquids affect plant growth. Each plant in the experiment is given a different liquid; water, apple juice, or milk. Each plant has the same amount of soil, sunlight, and listens to the same music. In this investigation, what is the dependent variable?
a)
Type of plant
b)
Water, apple juice, milk
c)
Plant growth
d)
Color of the plant's leaves
31.
What step does every scientific experiment begin with?
a)
hypothesis
b)
question/problem
c)
procedures
d)
conclusion
32.
This part of the experiment serves as a basis of comparison; the one variable being tested has been omitted. 
a)
experimental group
b)
control group
c)
data
d)
variables
33.
Why do we want to test only one independent variable at a time?
a)
Because it is hard to setup a data table with more than one variable
b)
To better identify what is causing the changes
c)
It is what has always been done
d)
It's easier to perform the experiment
34.
Which statement best describes the trend in the data?
a)
As temperatures increase, ice cream cone sales increase.
b)
As temperatures increase, ice cream cone sales decrease.
c)
As temperatures decrease, ice cream cone sales increase.
d)
There is no trend in the data.
35.
What month has the least birthdays ?
a)
Dec
b)
Aug
c)
Jan
d)
Sep
36.
What type of slope?
a)
positive
b)
negative
c)
no slope
d)
undefined
37.
What type of slope?
a)
negative
b)
positive
c)
zero slope
d)
downward slope
38.
Which instrument is used for precise measurements of liquids?
a)
graduated cylinder
b)
measuring cup
c)
beaker
d)
beaker
39.
What tool do we use to measure mass?
a)
graduated cylinder
b)
beaker
c)
ruler
d)
balance
40.
Which variable is found on the y-axis?
a)
Independent
b)
Manipulated
c)
Dependent
d)
Input
41.
On which axis is the independent variable found?
a)
z-axis
b)
w-axis
c)
y-axis
d)
x-axis
42.
Which type of graph best displays change over continuous variables such as temperature, time, and pH?
a)
line graph
b)
bar graph
c)
climatogram
d)
pie graph
43.
Which type of graph best compares groups of discrete data?
a)
line graph
b)
bar graph
c)
climatogram
d)
pie graph
44.
Which type of graph best displays percentages (parts) of a whole?
a)
line graph
b)
bar graph
c)
climatogram
d)
pie graph
45.

Based on this graph, which of the following statements is true?

a)

The anole weighs 2.5 grams after 3 days of observation

b)

The mass of the anole increased by 2.5 grams in 3 days

c)

The anole weighs 2.3 grams after 3 days

d)

The mass of the anole increased by 2.7 grams during the experiment

46.

A scientist performs an experiment to see if acids have an effect on the health of a particular type of plant. Three sets of plants were treated with acidic solutions of known pH while the control set was treated with a solution of neutral pH 7.

Which is the best conclusion for this experiment?

a)

Acid has no effect on the health of this type of plant

b)

High acidity, pH 2 is helpful to this type of plant.

c)

Low acidity, pH 6 is harmful to this type of plant.

d)

High acidity, pH 2 is harmful to this type of plant.

47.
a)

The reaction occurred FASTER with the enzyme

b)

The reaction occurred SLOWER with the enzyme

c)

Energy is absorbed and stored

d)

Energy absorbed increases, then decreases

48.
a)

Graph A best illustrates the relationship between the heat released by the foods listed in Table 1 and the change in water temperature.

b)

Graph B best illustrates the relationship between the heat released by the foods listed in Table 1 and the change in water temperature.

c)

Graph C best illustrates the relationship between the heat released by the foods listed in Table 1 and the change in water temperature.

d)

Graph D best illustrates the relationship between the heat released by the foods listed in Table 1 and the change in water temperature.

49.

Based on the graph shown on tomato height, what limiting factors may have contributed to the height growth of Plant C compared to Plant's A & B?

a)

temperature, amount of water, nutrient levels, light exposure

b)

lack of copper and zinc in soil

c)

excessive light exposure and amount of water

d)

none of the above

50.
a)

The overall trend in the data would be best described as increasing

b)

The overall trend in the data would be best described as decreasing

c)

The overall trend in the data would be best described as unchanging

d)

The overall trend in the data would be best described as unrelated

51.
a)

The concentration of CO2 in the atmosphere is increasing

b)

The concentration of CO2 in the atmosphere is decreasing

c)

The concentration of CO2 fluctuates too much to form a valid conclusion

d)

There is more CO2 in Hawaii than anywhere else

52.
a)

This data set shows that global temperatures are increasing over time

b)

This data set shows that global temperatures are decreasing over time

c)

This data set shows that carbon dioxide is increasing over time

d)

This data set shows that carbon dioxide is increasing over time

53.
The oscillation (up and down) of the data most likely represents
a)
seasonal variations
b)
climate change
c)
different years
d)
data collected at different places
54.
a)

The graph shows CO2 is increasing but temperature is decreasing

b)

The graph shows both temperature and CO2 are increasing

c)

The graph shows both CO2 and temperature are decreasing

d)

The graph shows CO2 is decreasing but temperature is increasing