
 Worksheets
SP25 Climate Test practice
Total questions: 36
Worksheet time: 19mins
Which of these models best represents the structure of the water molecule?


Water molecules bonding together weakly to form loose structures is called _____ bonding.
covalent
hydrogen
ionic
van der Waals
The heat capacity of water is unusually high compared to other liquids, and this means it takes a lot of heat energy to raise each gram of water by one degree C.
Which amount of water would take the longest to change temperature by 5 deg. C?
1 liter
10 liters
1000 liters
an entire ocean
A system at equilibrium is in a state of:
balance
imbalance
Positive feedback works to ______ the output of a system.
increase or build
maintain
decrease or limit
Negative feedback works to ______ the output of a system.
increase or build
maintain
decrease or limit
Which one or more of these contributes to the Earth having an overall stable climate?
the atmospheric greenhouse effect
the oceans absorbing or releasing heat
the sun providing energy through solar radiation
large meteor impacts and massive volcanic eruptions
The "enhanced" greenhouse effect in our atmosphere caused by large amounts of greenhouse gas releases over short periods of time is an example of which type of feedback system?
positive
negative
it doesn't represent a feedback system

Which one or more of these statements describes the data in this graph about the mass of carbon emitted to the atmosphere?
it was steady and then increased
it was steady and then decreased
it began to increase around 1900
it increased greatly after about 1950

Which one or more of these statements describes the data in this graph about the concentration of carbon dioxide in the atmosphere?
it was steady and then increased
it was steady and then decreased
it began to decrease around 1870
it increased greatly after about 1950

Do these data show a correlation for the amount of methane in the atmosphere and the change in global temperature?
yes
no

Do these data show a correlation for the amount of carbon dioxide in the atmosphere and the change in global temperature?
yes
no

Feedback A in this diagram is considered positive feedback because:
it continues to increase the surface temperature
it maintains the same surface temperature
it decreases the surface temperature
Feedback B in this diagram is considered negative feedback because:
it continues to increase the surface temperature
it maintains the same surface temperature
it decreases the surface temperature
The pH scale is based on the concentration of which of these ions?
H+ (hydrogen)
OH- (hydroxide)
sodium (Na+)
chloride (Cl-)
An INCREASE in acidity means the value of the pH:
is larger
stays the same
is smaller
CO2 (carbon dioxide) in the atmosphere dissolves in ocean waters and some of this dissolved CO2 becomes _____ acid through a chemical reaction with the water.
hydrochloric
nitric
carbonic
humic
Carbonic acid naturally breaks down slightly to produce some H+ ions and this can causes what change to the pH of the water?
increase
does not change pH
decrease
Which of these compounds is not a greenhouse gas?
Water vapor (H2O)
Carbon dioxide (CO2)
Methane (CH4)
Nitrogen (N2)
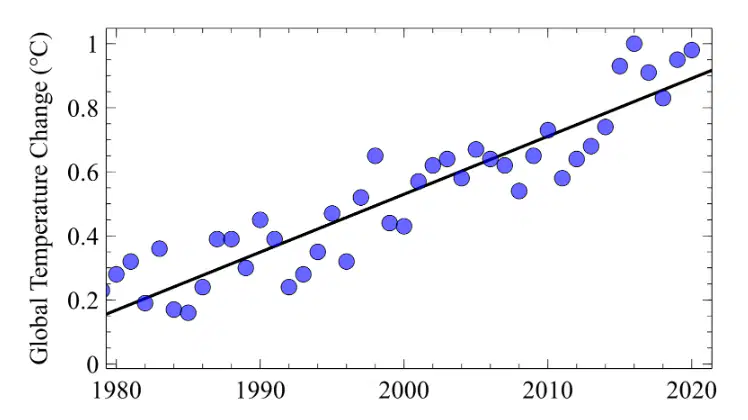
What does this graph indicate about global temperature?
temperature has increased from 1980 to 2020
temperature has decreased from 1980 to 2020
temperature has not changed from 1980 to 2020
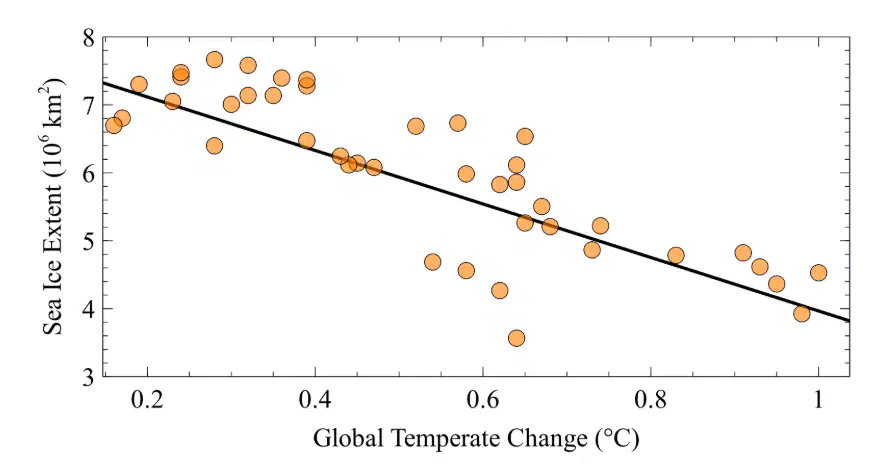
Which of the following is indicated based on this graph?
Arctic sea ice extent has decreased with increased global temperature
Arctic sea ice extent has increased with increased global temperature
Arctic sea ice extent has not changed with increased global temperature
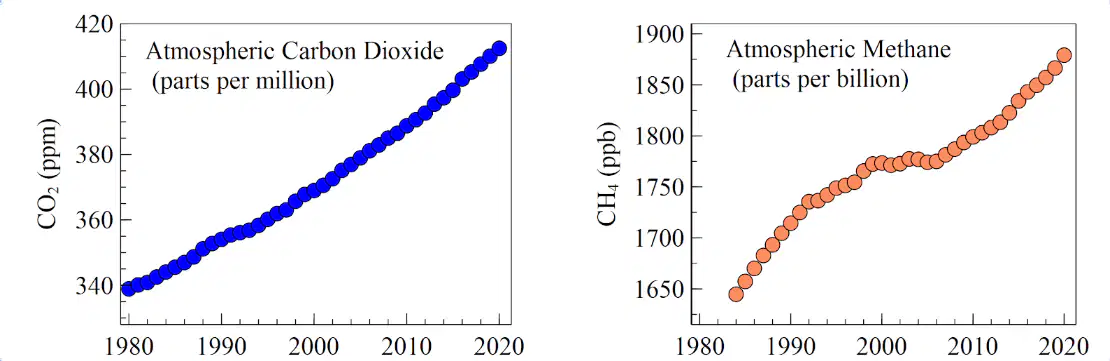
Which statement is not consistent with the two plots below?
CO2 has steadily increased
CH4 has generally increased
CO2 and CH4 have both decreased
Which of these represents the chemical formula of Ozone?
CO
O2
O3
CO2
Which type of radiation from the Sun produces ozone in the atmosphere?
Infrared
Visible light
Ultraviolet
X-ray
Which type of radiation from the Sun is mostly blocked by the ozone layer in the atmosphere?
Infrared
Visible light
Ultraviolet
X-ray
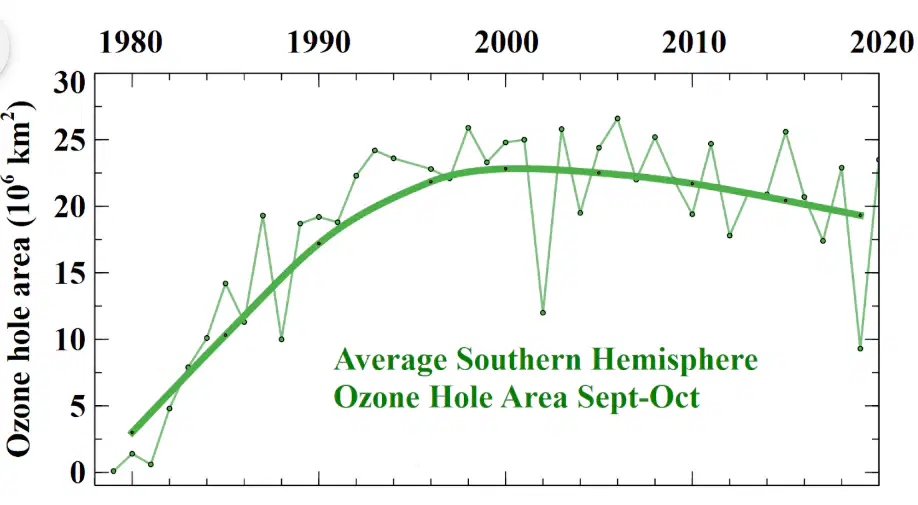
During which period of time did the ozone hole area increase?
1980-1995
1995-2005
2005-2015
from 2015 onward
Carbon stored in geologic materials that is burned as fuel for human use is referred to as:
Fossil fuel
Reservoir
Sink
Source
A place where matter or energy is stored is referred to as a
Fossil fuel
Reservoir
Sink
Source
A place that can absorb or accumulate particular forms of matter or energy is referred to as:
Fossil fuel
Reservoir
Sink
Source
Carbon stored in geologic materials that is burned as fuel for human use is referred to as:
Fossil fuel
Reservoir
Sink
Source
A place that serves to supply particular forms of matter or energy is referred to as:
Fossil fuel
Reservoir
Sink
Source
The mostly solid part of the Earth, including rocks and soil is called the
Atmosphere
Biosphere
Geosphere
Hydrosphere
The blanket of gasses that surrounds the Earth, including water vapor is called the
Atmosphere
Biosphere
Geosphere
Hydrosphere
Composed of all the forms of life in the geosphere, hydrosphere and atmosphere is called the
Atmosphere
Biosphere
Geosphere
Hydrosphere
All of the Earth's water except the water that is in the atmosphere is called the
Atmosphere
Biosphere
Geosphere
Hydrosphere
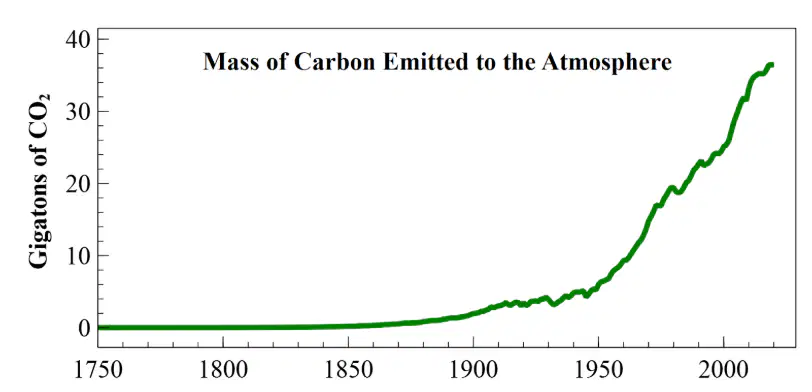
Based on this graph, when has carbon emission increased most rapidly?
1750 - 1850
1850 - 1950
1900 - 1950
1950 - 2000

