
 Worksheets
ACT bio questions practice
Total questions: 49
Worksheet time: 1hrs 22mins
The one factor that a scientist controls during an experiment. This goes on the x-axis.
Independent Variable
Dependent Variable
The variable that is measured. It goes on the y-axis.
Independent Variable
Dependent Variable


When should a bar graph be used?
When comparing parts of a whole
When showing change over time
When comparing data between different groups of categories
Whenever you want
When should a line graph be used?
When comparing parts of a whole
When showing change over time
When comparing data between different groups of categories
Whenever you want

According to the pie chart, how much of a house's water usage is for showers?
26.7%
13.7%
21.7%
16.8%
What is a variable?
something used to compare the parts of a whole
Something that is useful for displaying data or information that changes over time
Any display of information with tabs, rows and/or columns
Anything in an experiment that can change and can affect the outcome of the experiment


What is a data table?
Is a visual tool that uses that uses bars to compare data among categories
Used to compare the parts of a whole
Any display of information in tabular form, with rows and or columns named
Is a visual tool that uses that uses lines to compare data among categories

The cooler the temperature, the louder the crickets chirp.
The crickets cannot chirp at temperatures lower than 10 degrees C.
The warmer the temperature, the more often crickets chirp.
The temperature and the chirping of crickets are not related.

You did a survey among 35 teenagers about their favorite sports. What graph should you use to represent the number of responses in each sport?
bar graph
line graph
This variable in an experiment is the one being purposefully changed (or manipulated) by the scientist before the experiment is even conducted.
An experiment is performed on plants to see how different liquids affect plant growth. Each plant in the experiment is given a different liquid; water, apple juice, or milk. Each plant has the same amount of soil, sunlight, and listens to the same music. In this investigation, the independent variable is _____________.
the type of plant
the amount of sunlight
the type of music
the type of liquid
If you increase the amount of spinach you eat, then you will increase the iron in your blood.
What's the dependent variable in the statement above?
You will want your experiment to have ____ independent variable(s) in it for the experiment to be scientifically valid.
In an experiment to find out how the temperature affects the bounce height of a ball, the dependent variable is _____________.

Total cost of mowing

What is the dependent variable of the graph?
A student wants to test the effects of different types of exercise on heart rate. What would be the dependent variable of the experiment?
the measurement of heart rate
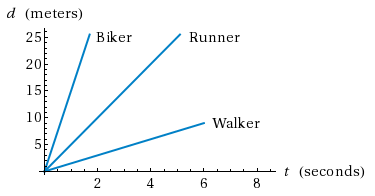
Which person moved the fastest in 3 seconds?
biker
runner
walker
they are all moving equally

According to figure 2, at what temperature did glycerin rise 80 mm?
57 °C
40 undefined
30 undefined
50 undefined

At what temperature did ethanol rise exactly 60 mm?
57 °C
40 °C
30°C
35°C

What liquid rose the least at 40°C
Ethanol
Water
Salt Water
Glycerin

At what temperature did all of the liquids rise equally?
30°C
25°C
20°C
40°C

Which of the following temperatures created the greatest rise in salt water?
55°C
45°C
35°C
25°C

Which of the following temperatures created the least rise in water?
20°C
25°C
35°C
40°C

A researcher is conducting an experiment in a solution that becomes basic upon completion. According to Figure 1, the reaction is complete when:
the addition of bromocresol green results in a blue color.
any indicator turns violet.
any indicator turns blue.
the addition of bromothymol blue results in a blue color.
Suppose that a researcher has two test tubes of an identical solution. When bromocresol green is added to one test tube, it turns blue, and when phenolphthalein is added to the other test tube, it is colorless. According to Figure 1, which of the following could be the pH of the solution?
6
7
7.5
8.5

Which of the following indicators undergo a color change between pH 7 and pH 10?
Bromocresol green and bromothymol blue
Phenolphthalein and thymol blue
Alizarin and sodium indigo sulfonate
Phenolphthalein and bromothymol blue
Which of the following hypotheses is consistent with the information in Figure 1?
Color changes for all acid-base indicators occur in solutions with a pH less than 7.
Color changes for all acid-base indicators occur in solutions with a pH greater than 7.
Color changes for acid-base indicators can always be used to determine if a solution is either acidic or basic.
Color changes for acid-base indicators vary within the pH range.

Compared to bromothymol blue, phenolphthalein undergoes a color change at:
a higher pH level because it reacts in more basic solutions.
a lower pH level because it reacts in more basic solutions.
a higher pH level because it reacts in more acidic solutions.
a lower pH level because it reacts in more acidic solutions.
Black coffee has a pH of approximately 5. A researcher wants to determine whether adding milk causes coffee to change pH; if the coffee could be diluted so that it does not interfere with the color displayed by an indicator, which of the following indicators would be the most useful?
Methyl orange
Bromothymol blue
Bromocresol green
Alizarin

Which pigment had the highest absorption rate at 660 nm wavelength?
Chlorophyll A
Chlorophyll B
Carotenoids
All the same
Which pigment had the lowest absorption rate at 550 nm wavelength?
Chlorophyll A
Chlorophyll B
Carotenoids
All the same

The cat has orange fur on his ears.

According to the passage, neonicotinoids are a type of:
parasite
pollinator
pesticide
pathogen

According to Scientist 1, neonicotinoids:
have been directly linked to declines in honeybee populations.
affect honeybees by increasing their vulnerability to parasites.
provide agricultural benefits that outweigh the risk to honeybees.
are the greatest threat to honeybee health in the United States.

Scientist 1 identifies all of the following crops as being highly dependent on pollination by honeybees except:
cherries
almonds
carrots
apples

The major difference between the two scientists' viewpoints is that:
Scientist 1 believes honeybee populations should be saved, while Scientist 2 believes humans should not interfere with honeybee populations.
Scientist 1 believes all threats to honeybee health should be addressed, while Scientist 2 believes that efforts should focus on the greatest threats to these populations.
Scientist 1 believes honeybee populations are declining in the United States, while Scientist 2 believes that honeybee populations are stable.
Scientist 1 believes neonicotinoids are harmful to honeybees, while Scientist 2 believes neonicotinoids do not pose any threat.
If you dissolve a tsp. of salt in water, what is the solvent?
water
salt

According to recent temperature trends in New York City, one might predict which temperature on day 7?
59
83
67
72

A scientist studying a species of flower that grows on the side of a mountain measured the height of many of the flowers at different elevations. His results are shown in the graph. Which statement best describes the pattern of growth for the flowers during this experiment?
The flowers cannot grow below elevations of 1,000 meters.
The flowers’ heights increase with higher elevation.
The flowers’ heights are unaffected by elevation.
The flowers grow taller at elevations of around 3,000 meters.

