
 Worksheets
Motion in 1-D
Total questions: 35
Worksheet time: 32mins

A driver brings a car to a full stop in 4.0 s. If the car was initially
traveling at 40 m/s, what is the acceleration?
(a)

If an airplane starts from rest and accelerates at a constant 4.00 m/s2 for 15.0 s, then what is its displacement?
(a)

If a car comes to a full stop over a distance of 80 m using a constant acceleration of -10.0 m/s2, then what was its initial velocity?
(a)
Slope of displacement -time graph gives
velocity
speed
acceleration
displacement
The unit of linear acceleration is
sm
s2 m
s2 rad
Which one of the choices gives you displacement?
area under a velocity-time graph
slope of a velocity-time graph
slope of a position-time graph
area under a position-time graph
Slope of velocity -time graph gives
velocity
speed
acceleration
displacement
An arrow fired straight up remains in the air for 6 s, what was the arrow's velocity in ft/s at the highest point of its flight?
(a)
An arrow fired straight up remains in the air for 6 s, what was the
arrow's vertical displacement in feet at the highest point of its flight?
d=21gt2 , use g=32 s2ft
(a)
Which graph best represents the motion of an object that has a positive acceleration for a period of time?


Which graph best represents the motion of the block of ice on the ramp?


A bicyclist starts from rest and accelerates along a straight path to a speed of 12.15 m/s in a time of 4.5 s. What is the bicyclist’s acceleration in m/s2?
(a)

In which section of the graph is the car moving away from its starting point?
W
X
Y
Z
In which section of the graph is the car moving back to its starting point?
W
X
Y
Z
A bicycle is traveling at 3 m/s. The rider applies the brakes and stops the bicycle in 3 s. What is the average rate of acceleration of the bicycle during this time?
(a)
John drove a truck for one hour at a rate of 80 km/hr. The next hour, he drove at 100 km/hr. What was his average speed during those two hours?
(a)

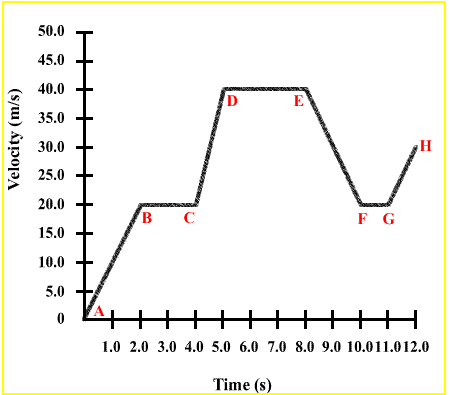
At what rate of speed did Swimmer 1 travel throughout the race?
(a)


a=Δt(vf−vi)
A dog runs with an initial speed of 7.5 m/s on a waxed floor. It slides to a stop in 15 seconds. What is the acceleration?
-7.5 m/s
-7.5 m/s2
-0.5 m/s2
7.5 mi//hr
In which of the following cases does the car have zero acceleration?
A car shortly after a stoplight turns green.
A car approaching a red light
A car with the cruise control set at 80 km/h
A car turning a curve at a constant speed
a=Δt(vf−vi)
A car accelerates from a standstill to 70 m/s in 10 seconds. What is the acceleration?
0.7m/s2
7m/s2
14m/s2
none of the above
a=Δt(vf−vi)
Mark slams on the brakes after traveling 25 m/s. It takes him 3.0 seconds to come to a complete stop. What is his acceleration?
8.3 m/s/s
-8.3 m/s/s
75 m/s/s
-75 m/s/s
t=a(vf−vi)
How much time did it take Matthew to slow down to a complete stop, after traveling at 30 m/s. His acceleration is -12 m/s/s
2.5 s
360 s
0.4 s
-2.5 s
vf=vi+at
A cart rolling down an incline for 5.0 s has an acceleration of 4.0 m/s/s. If the cart has a beginning speed of 2.0 m/s, what is the final velocity? (a) m/s

This is a velocity-time graph. What is the object doing in segment B?
Speeding up
Slowing down
Constant Velocity
Not moving
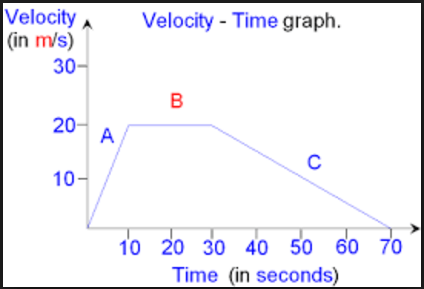
This is a velocity-time graph. What is the object doing in segment C?
Speeding up
Slowing down
Constant Velocity
Not moving
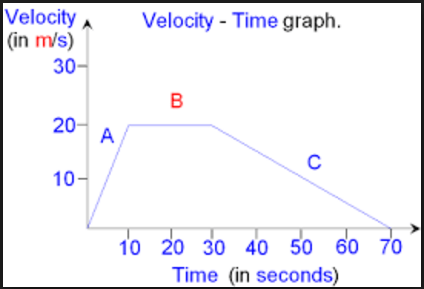
This is a velocity-time graph. What is the object doing in segment A?
Speeding up
Slowing down
Constant Velocity
Not moving

The graph shows the relationship between speed and time for two objects, A and B. Compared with the acceleration of object B, the acceleration of object A is
one-third as great
the same
three times as great
twice as great

This is a position-time graph. What is the object doing in segment B?
Moving towards the starting point
Moving towards the starting point
Constant Velocity
at rest

This is a position-time graph. What is the object doing in segment C?
Moving away from the starting point
Moving towards the starting point
Constant Velocity
at rest

This is a position-time graph. What is the object doing in segment A?
Moving away from the starting point
Moving towards the starting point
Constant Velocity
at rest

