
 Worksheets
Unit 2 Review
Total questions: 25
Worksheet time: 6hrs 15mins

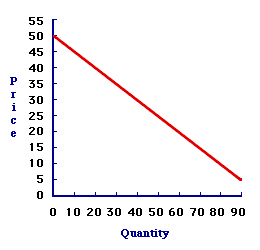


What could cause the shift from D1 to D2?
A change in preferences
A change in price
A change in quantity demanded
A change in quantity supplied

This graph represents...?
Changes in quantity demanded
Changes in quantity supplied
Changes in demand
Changes in supply

This graph represents...?
Changes in quantity demanded
Changes in quantity supplied
Changes in demand
Changes in supply

If the supply curve on this graph represents iPhones, what would cause the change from S to S1 (red to purple line)?
An increase in computer chips
An increase in the cost of producing an iPhone
Employees figure out a way to work more efficiently
The price of iPhones increases

If Tom Brady unretires and wins a Super Bowl, what will happen to the demand curve for Tom Brady jerseys (in theory)?
It will shift to the right
It will shift to the left
It won't shift
The price will go down

The point in the middle of the two curves represents or shows....?
Market Equilibrium
An increase in supply
A shortage
A surplus


New technology advances the rate at which furniture can be assembled. Why does this change the supply?
There is a change in cost of production.
The number of producers changes.
The expectations of consumers changes.
The output rate declines.
Which statement expresses a central idea of how the laws of supply and demand work?
The government sets the prices for goods and services.
Prices are determined by the interaction of producers and consumers.
Consumers alone determine the prices for goods and services.
Technology dictates the prices charged for goods and services.
If the price of a substitute to good X increases, then
The demand for good Y will increase.
The market price of good X will decrease.
The demand for good Y will decrease.
The demand for good X will not change.
If the demand for X decreases, then the demand for the complementary good Y will...
Increase
Remain the same
Decrease
There's not enough information to answer this question

