
 Worksheets
Stage 5.2 Bivariate data analysis
Total questions: 54
Worksheet time: 2hrs 17mins
The amount of people at the beach was recorded every hour of the day from 9am until 5pm.
What is the independent variable?
People
Time
Tide
Sand
A group of Year 10 students recorded their height and their maths results on a scatter plot. What relationship would you expect?
Negative
Positive
No correlation
Romantic
Identify the strong negative correlation.


If you score 100 on Game A, what score might you expect on Game B?
0
30
60
90

If someone watched 20 hours of TV per week, how long would the data suggest they worked that week?
30 hours
40 hours
20 hours
10 hours

Use the data to select the best prediction of the ATAR of someone who studies 5 hours per week
35
45
55
65
What do you call the data that involve two variables?
univariate data
bivariate data
multivariate data
data analysis
Use the data set 2,3,3,4,5,7,8,8,8,10,10,12.
Find the mode of the data.
632
7.5
8
No mode

How many students have a shoe size bigger than 8?
2
3
9
4
To find the average or mean of a set of numbers, add up all the items and divide by...
2
The maximum
The minimum
The number of items

What are the three measures of centre? (Check all the apply)
range
median
quartile
mode
mean
The number that occurs most often in a data set is called the __________
mean
median
mode
range
If there are two modes, we say that the data set is bimodal.
True
False
The middle number in an ordered set of data is called the ___________
mean
median
mode
range
When you are trying to find the MEDIAN of a set of data and 2 numbers are left in the middle after putting them in order from least to greatest, what do you do?
List both numbers as the median
Add the 2 numbers and divide by 2 (take the average)
Pick the one you want
Subtract the 2 numbers
The highest number minus the lowest number in a set of data is called the __________
mean
range
median
maximum


The outside temperature and the amount of layers of clothing you wear.



Estimate the correlation coefficient for this scatterplot.
A) r = -0.9
B) r = 1
C) r = 0.9
D) r = -1

Is r = -0.87 strong, moderate, or weak?
strong
moderate
weak
Which graph represents data that has a correlation coefficient close to -1?
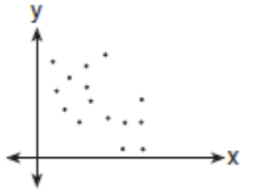
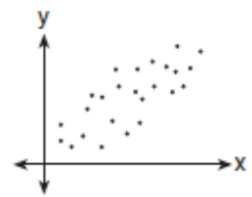
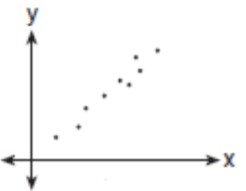
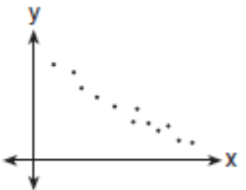

What type of correlation does this graph show?
Positive correlation
Negative correlation
No correlation
Constant correlation


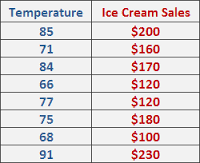
Find the equation of the line of best fit for the given data
y = 163.41x+1.49
y =- 163.41x+ 4.19
y =- 4.19x+163.41
y = 4.19x -163.41


What was the slowest race time?
28.9 secs
26.2 secs
25.3 secos
25 secs

Which time got 4th place in the race?
27.2secs
26.2secs
25.7secs
28.9secs

What was the highest priced ticket?
$49
$409
$125
$402 689

This stem and leaf shows the weight of each crate of apples. Which weight appeared the most often?
59kg
4kg
64kg
2kg

How many crates of apples weighed 59kg?
1
2
3
0
2, 57, 38, 42, 6
23, 34, 27, 7, 30, 26, 28, 31, 34
What is the mean of the data below?
1 , 5 , 10 , 11 , 20
10
9.4
19
9.1
What is the mode of the data below?
12 , 14 , 5 , 12 , 5 , 12 , 11
5
12
5 and 12
11.8
Find the median, first quartile, third quartile, and interquartile range of the data.
32, 53, 72, 66, 47, 54, 49, 67, 71
Median: 54
First Quartile: 49
Third Quartile: 67
IQR: 18
Median: 54
First Quartile: 48
Third Quartile: 69
IQR: 21
Median: 54
First Quartile: 48
Third Quartile: 69
IQR: 22
Median: 54
First Quartile: 49
Third Quartile: 69
IQR: 20
Find the range of the data.
63, 71, 65, 66, 87, 53
32
33
34
35
Minimum: 1
Q1: 3
Median: 5
Q3: 7
Maximum: 9
What is the interquartile range of the data set below?
3, 5, 6, 6, 7, 8, 9
3
6
2
8
What do quartiles split data up into?
halves
thirds
fourths
fifths
17, 18, 18, 19, 20, 21, 21, 23, 25

