
 Worksheets
Year 7 - Exam Revision - Statistics and Probability
Total questions: 204
Worksheet time: 17hrs 0mins

What is the probability for the spinner to land on orange?
Impossible
Unlikely
Likely
Certain

Which color marble is unlikely to be pulled from the jar?
Green
Red
Blue
Is it likely, unlikely, certain or impossible to select a red marble from a box of 12 red marbles?
Impossible
Unlikely
Likely
Certain

Is it unlikely, likely, equally likely, or impossible to roll 5 when you roll a die one time?
Unlikely
Likely
Equally Likely
Impossible
Is it likely, unlikely, equally likely, or impossible to select a boy on a field trip from group of 35 students with 12 girls and 23 boys?
Likely
Unlikely
Equally Likely
Impossible
Is it likely, unlikely, certain or impossible to select of red marble from a box of marbles that have 12 white marbles?
Likely
Unlikely
Certain
Impossible
Are you likely or unlikely to do well on your math test if you practice and study before, give your best effort, and work out all your problems on your test?
Likely
Unlikely

Celine spins the spinner one time. Which of the following best describes the chances that the spinner will land on red?
Impossible
Unlikely
Likely
Certain
Leonard has a bag of 12 yellow marbles, 3 blue marbles, and 1 red marble. What is the probability that he will reach in and pull out a red marble?
Impossible
Unlikely
Likely
Certain

Vins spins the spinner one time. Which of the following best describes the chances that the spinner will land on the number 9?
Impossible
Unlikely
Even Chance
Likely
Evan's teacher put forty green pencils in a bag. Which of the following best describes the chance that Evan will pull out a green pencil?
Impossible
Unlikely
Likely
Certain

If Aryanah spins this spinner, she will MOST likely land on ___
Red
Yellow
Blue
Orange
Classify each of the following statement as either true or false.
It is likely that some people will use public transport next week.
true
false
Classify each of the following statement as either true or false.
Getting a tail on a coin and rolling a 6 on a 6-sided die are equally likely.
true
false
Classify each of the following statement as either true or false.
There is a 1 in 5 chance of randomly selecting the letter A from the word MARCH.
true
false
Classify each of the following statement as either true or false.
It is an even chance for a 6-sided die to show a number less than 3.
true
false
Consider a fair 6-sided die with the numbers 1 to 6 on it.
Rolling a 3 is unlikely.
true
false
Consider a fair 6-sided die with the numbers 1 to 6 on it.
Rolling a 5 is likely.
true
false
Consider a fair 6-sided die with the numbers 1 to 6 on it.
Rolling a 4 and rolling a 5 are equally likely events.
true
false
Consider a fair 6-sided die with the numbers 1 to 6 on it.
Rolling an even number is likely.
true
false
Consider a fair 6-sided die with the numbers 1 to 6 on it.
There is an even chance of rolling an odd number.
true
false
Consider a fair 6-sided die with the numbers 1 to 6 on it.
There is an even chance of rolling a multiple of 3.
true
false
Match up the event with an equally likely event.
Rolling a 2 on a 6-sided die
Selecting a black card from a fair deck of
52 playing cards
Rolling a number bigger than 4 on a 6-sided die
Selecting a diamond card from a fair deck of
52 playing cards
Rolling a 6 on a 6-sided die
Match up the event with an equally likely event.
Selecting a heart card from a fair deck of
52 playing cards
Selecting a black card from a fair deck of
52 playing cards
Rolling a number bigger than 4 on a 6-sided die
Selecting a diamond card from a fair deck of
52 playing cards
Rolling a 6 on a 6-sided die
Match up the event with an equally likely event.
Flipping a coin and tails landing face up
Selecting a black card from a fair deck of
52 playing cards
Rolling a number bigger than 4 on a 6-sided die
Selecting a diamond card from a fair deck of
52 playing cards
Rolling a 6 on a 6-sided die
Match up the event with an equally likely event.
Rolling a 1 or a 5 on a 6-sided die
Selecting a black card from a fair deck of
52 playing cards
Rolling a number bigger than 4 on a 6-sided die
Selecting a diamond card from a fair deck of
52 playing cards
Rolling a 6 on a 6-sided die

Consider the spinner shown, which is spun and could land with the arrow
pointing to any of the three colours. (If it lands on a boundary, it is re-spun
until it lands on a colour.)
There is an even chance that the spinner will point to green.
true
false
Consider the spinner shown, which is spun and could land with the arrow
pointing to any of the three colours. (If it lands on a boundary, it is re-spun
until it lands on a colour.)
It is likely that the spinner will point to red.
true
false
Consider the spinner shown, which is spun and could land with the arrow
pointing to any of the three colours. (If it lands on a boundary, it is re-spun
until it lands on a colour.)
It is certain that the spinner will point to purple.
true
false
Consider the spinner shown, which is spun and could land with the arrow
pointing to any of the three colours. (If it lands on a boundary, it is re-spun
until it lands on a colour.)
It is equally likely that the spinner will point to red or blue.
true
false
Consider the spinner shown, which is spun and could land with the arrow
pointing to any of the three colours. (If it lands on a boundary, it is re-spun
until it lands on a colour.)
Green is twice as likely to occur as blue.
true
false


How many total students were surveyed about their number of brothers and sisters? (add up all of the dots)
15
10
6
What is the mean of the data? (0's still count as numbers)
2.1333...
32
15
2.46
What is the median of the data?
2
1
3
12
What is the mode of the data?
2
1
4
12

The dot plot represents the results of a survey that
asked some people how many times they had flown overseas.
Use the graph to state how many people have flown
overseas once.
(a)
The dot plot represents the results of a survey that
asked some people how many times they had flown overseas.
How many people participated in the survey?
(a)
The dot plot represents the results of a survey that
asked some people how many times they had flown overseas.
What is the range of values?
(a)
The dot plot represents the results of a survey that
asked some people how many times they had flown overseas.
What is the median number of times flown overseas?
(a)
The dot plot represents the results of a survey that
asked some people how many times they had flown overseas.
What is the outlier?
(a)
The dot plot represents the results of a survey that
asked some people how many times they had flown overseas.
What is the mode?
(a)

In a Year 4 class, the results of a spelling quiz are
presented as a dot plot.
What is the most common score in the class?
(a)
In a Year 4 class, the results of a spelling quiz are
presented as a dot plot.
How many students participated in the quiz?
(a)
In a Year 4 class, the results of a spelling quiz are
presented as a dot plot.
What is the range of scores achieved?
(a)
In a Year 4 class, the results of a spelling quiz are
presented as a dot plot.
What is the median score?
(a)
In a Year 4 class, the results of a spelling quiz are
presented as a dot plot.
Identify the outlier.
(a)

From a choice of pink, blue, yellow, green or red, each student of Year 7B chose their favourite colour.
How many students chose yellow?
(a)
From a choice of pink, blue, yellow, green or red, each student of Year 7B chose their favourite colour.
How many students chose blue?
(a)
From a choice of pink, blue, yellow, green or red, each student of Year 7B chose their favourite colour.
What is the most popular colour?
(a)
From a choice of pink, blue, yellow, green or red, each student of Year 7B chose their favourite colour.
How many students participated in the class survey?
(a)

How tall was Joan on her 9th birthday?
(a)
How much did she grow between her 8th birthday and 9th birthday?
(a)
How much did Joan grow between her 8th and 12th birthdays?
(a)
How old was Joan when she had her biggest growth spurt?
(a)
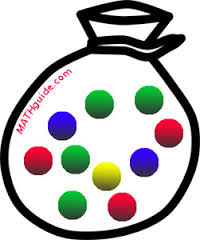
Find Pr (red marble)...
In a bag with 36 skittles, 12 are red, 9 are green, 3 are purple, 5 are orange, and 7 are yellow. What is the probability of picking a red skittle OR an orange skittle?
(a)

What is the probability of picking an orange marble OR a green marble?
53
65
21
41

What is the probability of NOT picking an orange marble?
43
65
32
61
On a six sided die, what is the probability of rolling a 3 OR a number greater than 4?
21
65
32
31

What is the probability of spinning the spinner and landing on a number greater than 6 OR less than 7?
82
0
1
86

5 green
6 yellow
8 blue
7 brown

1632%
3331%

1632%
3331%
6632%
8331%

What is the probability of spinning a number less than 2 ?
3/10
3/5
1/25
1/5

What is the probability of spinning a red or spinning a yellow?
1/8
1/16
1/2
1/3

What is the probability of spinning a yellow, green, or blue?
3/4
1/12
1/3
1/16


The following M & M colors are in the bowl:
4 yellow, 6 orange, 3 green, 5 blue, 2 brown
What is the probability of selecting a brown candy?
2/18
1/9
2/20
1/10

A regular 6-sided die is to be rolled once. What is the probability that a number less than 3 is rolled?
1/3
1/6
1/2
2/3

How many outcomes are there?
(a)

List the sample space
(a)

Pr (8)=
41
54
81
87

Pr (even)=
21
81
87
54

Pr (3 or 6)=
21
41
54
81

Pr(blue)=
21
119
112
31

Pr(red)=
21
115
116
41

Pr(purple or green)=
21
41
116
114
The letters in the word MATHS are written on 5 cards and then one is drawn from a hat. List the sample space.
M,A,T,H,S
1,2,3,4,5
5
1
The letters in the word MATHS are written on 5 cards and then one is drawn from a hat. Find Pr (T)
0.2
0.6
0.8
1
The letters in the word MATHS are written on 5 cards and then one is drawn from a hat. Find Pr (consonant is chosen)
0.2
0.6
0.8
1
The letters in the word MATHS are written on 5 cards and then one is drawn from a hat. Find the probability that the letter chosen is also in the word TAME.
20%
60%
80%
3
The letters in the word PROBABILITY are written on 11 cards and then one is drawn from a hat. Find Pr (P)
111
112
114
115
119
The letters in the word PROBABILITY are written on 11 cards and then one is drawn from a hat. Find Pr (P or L)
111
112
114
115
119
The letters in the word PROBABILITY are written on 11 cards and then one is drawn from a hat. Find Pr (letter chosen is in the word BIT)
111
112
114
115
119
The letters in the word PROBABILITY are written on 11 cards and then one is drawn from a hat. Find Pr (not a B)
111
112
114
115
119
The letters in the word PROBABILITY are written on 11 cards and then one is drawn from a hat. Find Pr (vowel is chosen)
111
112
114
115
119
What is the mean of this set of data?
2, 15, 7
24
3
6
8
2, 3, 4, 5, 5, 7
To find the average or mean of a set of numbers, add up all the items and divide by...
2
The minimum
The maximum
The number of items
5, 15, 10, 20, 15, 10, 15
Calculate the MODE for the data set: 6, 7, 12, 8, 7, 4, 8, 8, 7
7
7.44
8
7 and 8
What is the median of this set of score?
1, 2, 5, 6, 8, 8, 9, 12, 15
6
8
9
none of these

23, 34, 27, 7, 30, 26, 28, 31, 34

What kind of candy is your favorite?
Numerical
Categorical
Discrete
Continuous

How many goals have you scored this year?
continuous
discrete

How many states have your visited?
Categorical
Numerical

Students measure the height of a sunflower over 10 weeks.
Categorical
Numerical
Continuous
Discrete

The amount of books on a bookshelf isa type of (a) data.

The amount of time is take runners to finish a race is a type of (a) data.

______ can only take certain values.
continuous data
discrete data
Decide whether a primary source or a secondary source is suitable for collection of data on the following:
the average income of Australian households
primary
secondary
Decide whether a primary source or a secondary source is suitable for collection of data on the following:
the favourite toilet paper for households in Australia
primary
secondary
When an entire population is surveyed it is called a/an ____
census
sample
observation
When a subset of the population is surveyed it is called a/an ____
census
sample
observation
When we cannot choose the members to survey, and can only record those visible to us, eg. people posting their political views on a news website, it is called a/an ____
census
sample
observation
The dot plot represents the results of a survey that
asked some people how many times they had flown overseas.
How many people participated in the survey?
(a)
The dot plot represents the results of a survey that
asked some people how many times they had flown overseas.
What is the outlier?
(a)
From a choice of pink, blue, yellow, green or red, each student of Year 7B chose their favourite colour.
How many students chose yellow?
(a)
How tall was Joan on her 9th birthday?
(a)

12,10,10,10,13,12,11,13,10
4,2,7,4,3
12, 5, 9, 18, 22, 25, 5
8, 14, 32, 6, 15
6, 12, 16, 11, 8, 4, 1, 11, 4
What is the mean of the data below?
1 , 5 , 10 , 11 , 20
10
9.4
19
9.1
What is the median of the data below?
20 , 3 , 17 , 1 , 5
5
17
19
9.2
What is the mode of the data below?
12 , 14 , 5 , 12 , 5 , 12 , 11
5
12
5 and 12
11.8
What is the median of this data set?
3 , 17 , 17 , 11 , 8 , 13 , 5 , 18
11
12
13
17
4,5,5,2,3,3,2,8
28, 18, 19, 18, 17
5,5,5,5
Calculate the mean.
2, 9, 10, 6, 8
8
4
7
22
3, 5, 7, 4, 3, 1
What is the median cost
8, 10, 60, 3, 5, 13, 12, 40, 8
What is the range?
The sum of the largest and smallest number
The number in the middle
The difference between the largest and smallest number
The number that appears most often
What is the RANGE of her test scores?
Consider the ages (in years) of seven people who are surveyed in a shop:
15, 31, 12, 47, 21, 65, 12
If another person is surveyed who is 29 years old, what will be the new median?
(a)
Consider the test scores of 5 people: 25, 19, 32, 25, 29.
If a sixth person were included with a test score of 31, find the new median.
(a)
The median for the data set 5, 7, 7, 10, 12, 13, 17 is 10. What would be the new median if 9 is added to the data set.
(a)
The median for the data set 5, 7, 7, 10, 12, 13, 17 is 10. What would be the new median if 12 is added to the data set.
(a)
The median for the data set 5, 7, 7, 10, 12, 13, 17 is 10. What would be the new median if 20 is added to the data set.
(a)
The median for the data set 5, 7, 7, 10, 12, 13, 17 is 10. What would be the new median if 2 is added to the data set.
(a)
Consider the ages (in years) of nine people who are surveyed at a train station:
18, 37, 61, 24, 7, 74, 51, 28, 24.
If another person is surveyed who is 42 years old, what will be the new median?
(a)
Classify the following as categorical or numerical:
the eye colour of each student in your class
categorical
numerical
Classify the following as categorical or numerical:
the date of the month each student was born, e.g. the 9th of a month
categorical
numerical
Classify the following as categorical or numerical:
the weight of each student when they were born
categorical
numerical
Classify the following as categorical or numerical:
the brands of airplanes landing at Melbourne’s international airport
categorical
numerical
Classify the following as categorical or numerical:
the temperature of each classroom
categorical
numerical
Classify the following as categorical or numerical:
the number of students in each classroom period one on Tuesday
categorical
numerical
Classify the following variables as categorical, continuous numerical or discrete numerical data:
the number of cars per household
categorical
continuous numerical
discrete numerical
Classify the following variables as categorical, continuous numerical or discrete numerical data:
the weights of packages sent by Australia Post on 20 December
categorical
continuous numerical
discrete numerical
Classify the following variables as categorical, continuous numerical or discrete numerical data:
the highest temperature of the ocean each day
categorical
continuous numerical
discrete numerical
Classify the following variables as categorical, continuous numerical or discrete numerical data:
the favourite brand of chocolate of the teachers at your school
categorical
continuous numerical
discrete numerical
Classify the following variables as categorical, continuous numerical or discrete numerical data:
the colours of the cars in the school car park
categorical
continuous numerical
discrete numerical
Classify the following variables as categorical, continuous numerical or discrete numerical data:
the brands of cars in the school car park
categorical
continuous numerical
discrete numerical
Classify the following variables as categorical, continuous numerical or discrete numerical data:
the number of letters in different words on a page
categorical
continuous numerical
discrete numerical
Classify the following variables as categorical, continuous numerical or discrete numerical data:
the number of advertisements in a time period over each of the free-to-air channels
categorical
continuous numerical
discrete numerical
Classify the following variables as categorical, continuous numerical or discrete numerical data:
the length of time spent doing this exercise
categorical
continuous numerical
discrete numerical
Classify the following variables as categorical, continuous numerical or discrete numerical data:
the arrival times of planes at JFK airport
categorical
continuous numerical
discrete numerical
Classify the following variables as categorical, continuous numerical or discrete numerical data:
the daily pollutions level in the Burnley Tunnel on the City Link Freeway
categorical
continuous numerical
discrete numerical
Classify the following variables as categorical, continuous numerical or discrete numerical data:
the number of text messages sent by an individual yesterday
categorical
continuous numerical
discrete numerical
Classify the following variables as categorical, continuous numerical or discrete numerical data:
the times for the 100 m freestyle event at the world championships over the last 10 years
categorical
continuous numerical
discrete numerical
Classify the following variables as categorical, continuous numerical or discrete numerical data:
the number of Blu-ray discs someone owns
categorical
continuous numerical
discrete numerical
Classify the following variables as categorical, continuous numerical or discrete numerical data:
the brands of cereals available at the supermarket
categorical
continuous numerical
discrete numerical
Classify the following variables as categorical, continuous numerical or discrete numerical data:
marks awarded on a maths test
categorical
continuous numerical
discrete numerical
Classify the following variables as categorical, continuous numerical or discrete numerical data:
the star rating on a hotel or motel
categorical
continuous numerical
discrete numerical
Classify the following variables as categorical, continuous numerical or discrete numerical data:
the censorship rating on a movie showing at the cinema
categorical
continuous numerical
discrete numerical
Is observation or a sample or a census the most appropriate way to collect data on each of the following?
the arrival times of trains at Southern Cross Station during a day
observation
sample
census
Is observation or a sample or a census the most appropriate way to collect data on each of the following?
the arrival times of trains at Southern Cross Station over the year
observation
sample
census
Is observation or a sample or a census the most appropriate way to collect data on each of the following?
the heights of students in your class
observation
sample
census
Is observation or a sample or a census the most appropriate way to collect data on each of the following?
the heights of all Year 7 students in the school
observation
sample
census
Is observation or a sample or a census the most appropriate way to collect data on each of the following?
the heights of all Year 7 students in Victoria
observation
sample
census
Is observation or a sample or a census the most appropriate way to collect data on each of the following?
the number of plastic water bottles sold in a year
observation
sample
census
Is observation or a sample or a census the most appropriate way to collect data on each of the following?
the religions of Australian families
observation
sample
census
Is observation or a sample or a census the most appropriate way to collect data on each of the following?
the number of people living in each household in your class
observation
sample
census
Is observation or a sample or a census the most appropriate way to collect data on each of the following?
the number of people living in each household in your school
observation
sample
census
Is observation or a sample or a census the most appropriate way to collect data on each of the following?
the number of people living in each household in Australia
observation
sample
census
Is observation or a sample or a census the most appropriate way to collect data on each of the following?
the number of native Australian birds found in a suburb
observation
sample
census
Is observation or a sample or a census the most appropriate way to collect data on each of the following?
the number of cars travelling past a school between 8 a.m. and 9 a.m. on a school day
observation
sample
census
Is observation or a sample or a census the most appropriate way to collect data on each of the following?
the money spent at the canteen by students during a week
observation
sample
census
Is observation or a sample or a census the most appropriate way to collect data on each of the following?
the ratings of TV shows
observation
sample
census
Identify whether a primary or secondary source is
suitable for the collection of data on the following.
the number of soft drinks bought by the average
Australian family in a week
primary
secondary
Identify whether a primary or secondary source is
suitable for the collection of data on the following.
the age of school leavers in far North Queensland
primary
secondary
Identify whether a primary or secondary source is
suitable for the collection of data on the following.
the number of soft drinks consumed by school age
students in a day
primary
secondary
Identify whether a primary or secondary source is
suitable for the collection of data on the following.
the highest level of education by the adults in a
household
primary
secondary
Identify whether a primary or secondary source is
suitable for the collection of data on the following.
the reading level of students in Year 7 in Australia
primary
secondary

