
 Worksheets
Ch 3 Les 1 Test Review Quizizz
Total questions: 46
Worksheet time: 2hrs 46mins
If a car travels 400 m in 20 seconds, how fast is it going?
20 m/s
2 m/s
32 m/s
You arrive in my class 45 seconds after leaving math, which is 90 meters away, How fast did you travel?
3 m/s
2 m/s
4 m/s
speed =
speed x time
distance ➗ time
mass x velocity
distance ➗ speed


A runner races in the 100 meter dash. It takes her 10 seconds to finish. What is her average speed?
10 m/s
1000 m/s
100 seconds
10 seconds


Describe the motion in the graph:
Constant Speed (positive slope)
Stopped (at rest)
Acceleration (increasing speed)
Return Home (negative slope)
If an object travels 42 meters in 6 seconds, what is its average speed?
6 m/s
7 m/s
42 m/s
252 m/s
Which of the following is the correct formula for calculating speed?
Speed= force/distance (force divided by distance)
Speed= mass x acceleration (mass times acceleration)
Speed = distance/time (distance divided by time)
Speed = time x energy (time times energy)
Select all of the units that could be used for distance.
Meters
Seconds
Kilometers
Miles.
Calculate the average speed of a car that travels 60 km in 2 hours.
12 km/h
30 km/h
25 km/h
35 km/h
Select all of the units for time.
Seconds
Hours
Meters
Kilometers
A toy car can move 15 meters in 5 seconds. What is the speed of the toy car?
3 m/s
10 m/s
1 m/s
1.6 m/s
If a turtle travels 20 centimeters in 10 seconds, what is the speed of the turtle?
2 cm/sec
10 cm/sec
20 cm/sec
100 cm/sec
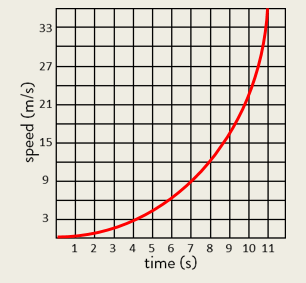
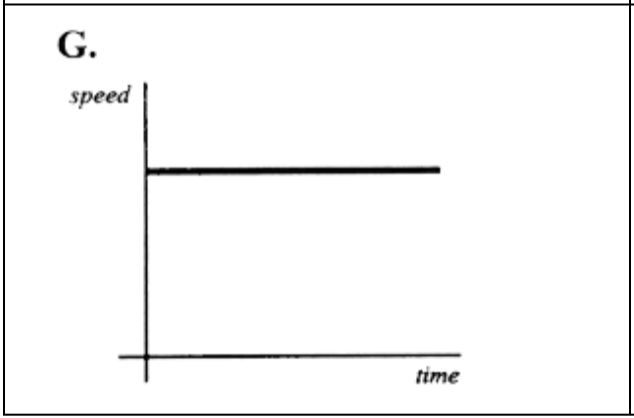
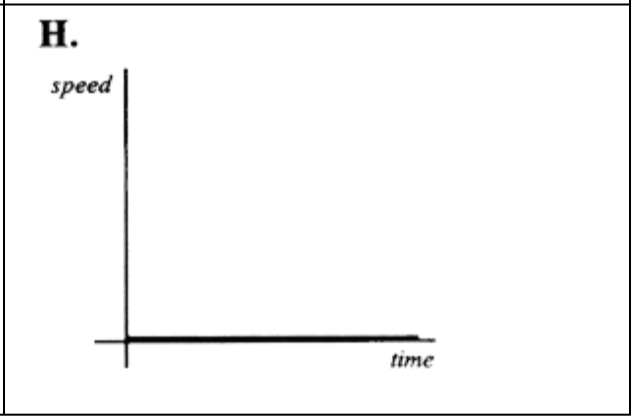
What is this graph showing?
Gradually slowing down
Gradually speeding up
Constant speed
Stopped
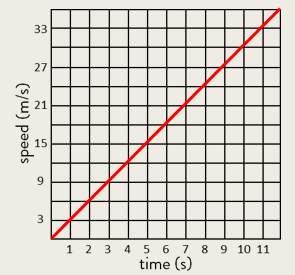
Accelerating gradually
Stopping
Slowing down constantly
Speeding up constantly

A toy car rolls 8 meters in 2 seconds. What is the average speed of the toy car?
16 m/s
4 m/s
.25 m/s
10 m/s


Time is always plotted on the X-axis (bottom of the graph). The further to the right on the axis, the longer the time from the start.
Distance is plotted on the Y-axis (side of the graph). The higher up the graph, the further from the start.


Time is increasing to the right, but its distance does not change. It is not moving. We say it is At Rest.


Time is increasing to the right, and distance is increasing constantly with time. The object moves at a constant speed.
Constant speed is shown by straight lines on a graph.


A worm traveled 50 centimeters in 5 minutes. What is the average speed of the snail?
10 centimeters per minute
25 centimeters per minute
250 centimeters per minute
1 centimeters per minute

_________________ describes how fast an object is moving.
direction
motion
force
speed
What is this graph showing?
Gradually slowing down
Gradually speeding up
Constant speed
Stopped

What is this graph showing?
At rest
Acceleration
Constant speed of 1 m/s
Gradually speeding up
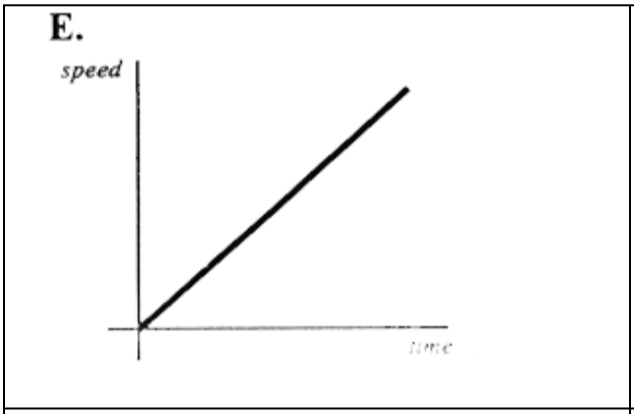
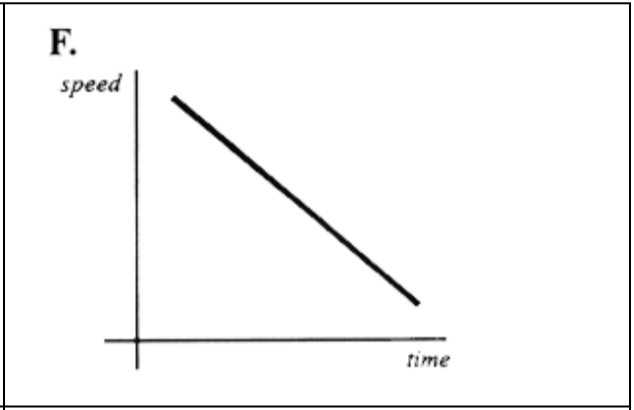
Match the graph to the description:
"The car is slowing down."




What were the two least favorite colors?
red and yellow
blue and green
green and yellow

How many people ate banana?
7
5
2
1


