
 Worksheets
Statistics Fall 2022 Take Home Final
Total questions: 145
Worksheet time: 4hrs 9mins


12,10,10,10,13,12,11,13,10
2, 57, 38, 42, 6
4,2,7,4,3


A restaurant recorded the number of pizzas sold each month for one year. The data are shown in the graph below. During which month did the restaurant sell 40 pizzas?
March
May
July
August

The National Survey of Adolescent Health interviewed several thousand teens (grades 7 to 12).
One question asked was “What do you think are the chances you will be married in the next ten years?”
How many TOTAL females responded?
46.1%
53.8%
2625
4877
If a distribution is skewed right, which of the following is usually true?
mean > median
mean < median
mean = median (approximately)
the median is the highest value
If a distribution is skewed left, which of the following is usually true?
mean > median
mean < median
mean = median (approximately)
the median is the highest value

The students in Mr. Tyson’s high school statistics class were recently asked if they would prefer a pasta party, a pizza party, or a donut party. The following bar graph displays the data. This graph is misleading because
the bars should be arranged in decreasing order by height.
the vertical axis scale should start at 0.
there should not be gaps between the bars.
it should be a histogram, not a bar graph.
preferred party should be on the vertical axis and number of students should be on the horizontal axis.

A survey was designed to study how business operations vary by size. Companies were classified as small, medium, or large. Questionnaires were sent to 200 randomly selected businesses of each size. Because not all questionnaires are returned, researchers decided to investigate the relationship between the response rate and the size of the business. The data are given in the following two-way table. What percent of all small companies receiving questionnaires responded?
33.30%
12.50%
62.50%
50.80%
20.80%

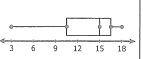
According to the box plot,
what is the MEDIAN?
79
85
93
70
99

What is the median age?
60
55
50
45

What percent of the college students surveyed have less than $2000 in debt?
25%
50%
75%
100%
If I tell you that you scored at the 55th percentile on your final exam, you would know:
55% of the class scored the same or worse than you did
You earned a 55% on the exam
You failed the exam
45% of the class scored worse than you did
Given a mean of 75 and a standard deviation of 7, what percentage of scores are above 82?
34%
81.5%
16%
2.5%

Realtors collect data in order to serve their clients more effectively. In a recent week, data on the age of all homes sold in a particular area were collected and displayed in this histogram. Which of the following could be the median age?
29 years
19 years
39 years
34 years
24 years
Realtors collect data in order to serve their clients more effectively. In a recent week, data on the age of all homes sold in a particular area were collected and displayed in this histogram. The standard deviation of the distribution of house age is about 16 years. Interpret this value.
The gap between the first quartile and the third quartile is 16 years.
The gap between the youngest and oldest house is 16 years.
The age of the houses in the sample typically varies by about 16 years from the mean age.
The age of all houses in the sample is within 16 years of the mean.
The age of all the houses in the sample is 16 years from the mean.

The percent scores for 10 students on their first matt test are shown. Which are the correct pair of lower and upper cutoffs for identifying outliers?
lower cutoff = 40, upper cutoff = 92
lower cutoff = 52, upper cutoff = 92
lower cutoff = 40, upper cutoff = 92
lower cutoff = 52, upper cutoff = 95
The percent scores for 10 students on their first math test are shown. What is the correct summary of the data?
Mean = 73
Median = 71.5
Range = 40
Q1 = 67
Q3 = 77
sx ≈ 11.0
Mean = 73
Median = 71.5
Range = 40
Q1 = 67
Q3 = 77
sx ≈ 10.5
Mean = 71.5
Median = 73
Range = 40
Q1 = 67
Q3 = 77
sx ≈ 11.0
Mean = 73
Median = 71.5
Range = 30
Q1 = 67
Q3 = 77
sx ≈ 11.0
A set of data has a mean that is much larger than the median. Which of the following statements is most consistent with this information?
the distribution is symmetric
the distribution is skewed left
the distribution is skewed right
the distribution is bimodal.
the data set probably has a few low outliers.

This is a boxplot of the birth weights (in ounces) of a sample of 160 infants born in a local hospital. About 40 of the births weights were below
92 ounces
102 ounces
112 ounces
122 ounces
132 ounces
What is the IQR of this data set?
6, 7, 2, 1, 5, 2, 1, 6
5
6
7
4.5

What is the Range of the data?
32
35
40
20

The stemplot displays the number of students taking statistics courses from 19 high schools. Key: 21|0 = 210 students.
What percent of school have more than 200 students taking statistics courses? Round your answer to the nearest tenth.
89.5%
85%
10.5%
78.9%

The distribution of both stemplots can be described as...
Symmetric
Skewed Right
Skewed Left
Uniform

A florist records the amount of money he spent on gasoline each week to deliver orders. The list shows the data for 16 weeks.
32, 38, 40, 44, 46, 49, 53, 55, 58, 62, 65, 68, 70, 72, 81, 84
He put the data in a stem-and-leaf plot. What number did he leave out of the stem-and-leaf plot?
32
44
65
84

How many observations were collected in this frequency table?
20
16
10
4


The dotplots compare the number of hours a group of teenagers spent on two activities.
Select the answer that is NOT true.
The data for exercise has a lower center than the data for video games.
Both dotplots appear to be skewed right.
Both dotplots appear to have outliers.
The time spent on video games had a greater range than the time spent on exercise.

Compare the two dotplots. Which statement is true?
Boys and girls had the same spread/range in their times.
Boys generally had longer times than girls.
The center of the boys' times is lower than the center for the girls times.
Both dotplots are skewed right.

Which group has a larger interquartile range?
Group A
Group B
They're the same
Cannot be determined.
Which group has a higher median reaction time?
Group A
Group B
They're the same
Cannot be determined.
Which group contained the person with the fastest response time?
Group A
Group B
They're the same
Cannot be determined.

What is the IQR of the Cruisers?
4
6
13
9

Which of the following statements is true?
The Interquartile range for females is 49.25 minutes
The Interquartile range for males is 67.15 minutes
The male runners have a larger Interquartile range than the female runners
The interquartile range is the same for female runners as male runners

What was the median score?
39
50
55
16

Which of the following best describes the shape of the distribution?
skewed left
skewed right
uniform
symmetrical
A random sample of scores at a bowling alley one day gives the following summary statistics:
n = 26,
x = 132.34, s = 10.18, min = 113, Q1 = 126,
med = 134.5, Q3 = 139, and max = 160
How many outliers are there?
0
1
2
At least 1
At least 2
In which of the following histograms is the mean greater than the median?


In order to rate TV shows, phone surveys are sometimes used. Such a survey might record several variables, some of which are listed below. Which of these variables are categorical?
I. The type of show being watched
II. The number of persons watching the show
III. The ages of persons watching the show
IV. The name of the show being watched
V. The number of times the show has been watched in the last month
II, III, IV
I only
I and V
I and IV
None of the options
Kitchen appliances don’t last forever. The lifespan of all microwave ovens sold in the United States is approximately Normally distributed with a mean of 9 years and a standard deviation of 2.5 years. What percentage of the ovens last more than 10 years?
11.5%
34.5%
65.5%
69%
84.5%
The distribution of weights of female college cross-country runners is approximately normal with mean 122 pounds and standard deviation 8 pounds. Which of the following is closest to the percent of the runners who weigh between 114 pounds and 138 pounds?
18%
32%
68%
82%
95%

On the math portion of the SAT, scores are roughly normal, with a mean of 500 and a standard deviation of 100. What percent of scores are above 400?
68%
81.5%
84%
99.7%
A study of child development measures the age (in months) at which a child begins to talk and also the child's score on an ability test given several years later. The study asks whether the age at which a child talks helps predict the later test score. The LSRL of test score "y" on age "x" is y-hat=110 - 1.3x. According to this regression line, what happens to children who talk one month later than other children?
Their predicted test scores go down 110 points
Their predicted test scores go down 1.3 points
Their predicted test scores go up 110 points
Their predicted test scores go up 1.3 points
Their predicted test scores are 108.7 points
A study gathers data on the outside temperature during the winter, in degrees Fahrenheit, and the amount of natural gas a household consumes, in cubic feet per day. Call the temperature x and gas consumption y. The house is heated with gas, so x helps explain y. The least-squares regression line for predicting y from x is:
y-hat = 1344 - 19x
On a day when the temperature is 20ºF, the regression line predicts that gas used will be about
1724 cubic ft
1383 cubic ft
1325 cubic ft
964 cubic ft
none of the above
There is a linear relationship between the number of chirps made by the striped ground cricket and the air temperature. A least squares fit of some data collected by a biologist gives the model
y hat = 25.2 + 3.3 x
where x is the number of chirps per minute and is the estimated temperature in degrees Fahrenheit. Find and interpret the residual in context for
the striped ground cricket who chirped 18 chirps per minute while it was 80°F.
Residual = 4.6°F. The temperature was 4.6°F higher than what was expected for a striped ground cricket who chirped 18 chirps per minute.
Residual = - 4.6 chirps. The striped ground cricket chirped 4.6 chirps less than what we expected at the temperature of 80°F.
Residual = 4.6 chirps. The striped ground cricket chirped 4.6 chirps more than what we expected at the temperature of 80°F.
Residual = - 4.6°F. The temperature was 4.6°F lower than what was expected for a striped ground cricket who chirped 18 chirps per minute.
Residual = 20.6°F. The temperature was 20.6°F higher than what we expected for a striped ground cricket who chirped 18 chirps per minute.

The height (in feet) and volume (in cubic feet) of usable lumber of 32 cherry trees are measured by a researcher. The goal is to determine if volume of usable lumber can be estimated from the height of a tree. In this study, the response variable is......
height of researcher
volume of lumber
height of tree
the measuring instrument used to measure volume
impossible to determine
The linear model to represent the distance (in miles) traveled given the time (in hours) driving is
50 miles
-50 miles
8 miles
-25 miles
The equation y=−26.16 + 1.58x can be used to predict a student's heart rate after a brisk walk around the school, if their resting heart rate (before the walk) is known. Suppose a student's resting heart rate is 65 bpm, and after the walk their heart rate is 80 bpm. What is the residual for this student?
76.54
3.46
-3.46
-76.54
The equation y=−26.16 + 1.58x can be used to predict a student's heart rate after a brisk walk around the school, if their resting heart rate (before the walk) is known. Interpret the slope of the LSRL.
A student's heartrate after the walk will be 1.58 times what their resting heartrate is.
If a student's resting heartrate increases 1 bpm, their heartrate after the walk is predicted to decrease 26.16 bpm
If a student's resting heartrate increases 1 bpm, their heartrate after the walk is predicted to increase 1.58 bpm
A student's heartrate before the walk is predicted to be 26.16 bpm lower than after the walk.
Data is obtained for a large group of college students relating the time they spent writing an essay and the grade on the essay. The equation is
grade = 30.18 + 6.49(time) with r = 0.724
What percentage of the variation in grades can be explained by looking at time spent on the essay?
52.4%
72.4%
27.6%
47.6%

Scientists examined the activity level of 7 fish at different temperatures. Fish activity was rated on a scale of 0 (no activity) to 100 (maximal activity). The temperature was measured in degrees Celsius. A computer regression printout and a residual plot are provided. Notice that the horizontal axis on the residual plot is labeled “Fitted value,” which means the same thing as “predicted value.”Which of the following gives a correct interpretation of 𝑠 in this setting?
The typical distance of the temperature readings from their mean is about 4.785°C.
The typical distance of the activity level readings from their mean is about 4.785 units.
At a temperature of 0°C, this model predicts an activity level of 4.785 units.
For every 1°C increase in temperature, fish activity is predicted to increase by 4.785 units.
The typical distance of the activity level ratings from the least-squares line is about 4.785 units.

(a) is the use of a regression line for prediction outside the interval of x values used to obtain the line.


With practice, people become faster at solving a certain type of mathematical puzzle. Fourteen college students were allowed to practice completing a certain type of mathematical puzzle for different amounts of time. Afterwards, each student’s completion time on a new puzzle was measured. The Residual plot for regression of Completion Time on Practice Time is shown below. Which of the following is correct?
There is a no relationship between Practice Time and Puzzle Completion Time.
This regression equation would likely overestimate the Puzzle Completion Time for 175 minutes of practice time.
There is a non-linear relationship between Practice Time and Puzzle Completion Time.
There is a linear relationship between Practice Time and Puzzle Completion Time.
Describe the strength and direction of following correlation coefficient.
r=−0.91
Strong positive
Weak positive
Strong negative
Weak negative


The relationship between selling price of a car (in $1,000) and its age (in years) is estimated from a random sample of cars of a specific model. The relationship is modeled with the following LSRL: (Selling Price - hat) = 24.2 - (1.182)(Age).
Which of the following statements can be concluded from this equation?
For every year the car gets older, the selling price drops by approximately $2420.
For every year the car gets older, the selling price goes down by approximately 11.82%.
On average, a new car costs about $11,820.
On average, a new car costs about $23,018.
For every year that the car gets older, the selling price drops by approximately $1,182.

The heights (in inches) and weights (in pounds) of six male Labrador Retrievers were measured. The height of a dog is measured at the shoulder. A linear regression was done, and the residual plot and computer output are given to the left.
Dakota, a male Labrador, was one of the dogs measured for this study. His height is 23.5 inches. What. is Dakota's actual weight?
Not enough information is provided.
1.6 lbs
73.42
75.02

Consider the following scatterplot of midterm and final exam scores for a class of 15 students.
Which of the following is incorrect?
The same number of students scored 100 on the midterm exam as scored 100 on the final exam
Students who scored higher on the midterm exam tended to score lower on the final exam.
The scatterplot shows a moderate negative correlation between the midterm and final exam scores.
The coefficient of determination here is positive.
No one scored 90 or above on both exams.
Data was collected on two variables x and y and an LSRL was fitted to the data. The resulting equation is y-hat = -2.29 + 1.70x. What is the residual for point (5,6)?
-2.91
-0.21
0.21
6.21
7.91
The linear model to represent the distance (in miles) traveled given the time (in hours) driving is
m=−1.79+61.93h . Predict how far a person will travel driving 10 hours.617.51 miles
621.09 miles
100 miles
0.19 miles

There is a linear relationship between the number of chirps made by the striped ground cricket and the air temperature. A least-squares fit of some data collected by a biologist is given
, where x is the number of chirps per minute and
is the estimated temperature in degrees Fahrenheit. What is the predicted increase in temperature for an increase of 5 chirps per minute?
3.3°F
16.5°F
25.2°F
28.5°F
41.7°F
Data were collected on y = price of car (in dollars) and x = age of car (in years) for each car in a sample of 60 used Toyota Camrys. A scatterplot showed a negative linear relationship between x and y. The least squares regression line was fit and the r2 value was computed. If r2 = 0.55, which of the following is a correct statement?
There is a very strong linear relationship between car price and number of miles driven.
For each additional mile driven, car price increases by approximately $0.55
Approximately 55% of the variability in car price can be explained by the linear relationship between car price and number of miles the car has been driven.
If the least-squares line is used to predict car price based on number of miles driven, predictions should be within $0.55 of the true price.
In a statistics course, a linear regression equation was computed to predict the final exam score from the score on the first test. The equation was yˆ =10+0.9x where y is the final-exam score and x is the score on the first test. Carla scored 95 on the first test. What is the predicted value of her score on the final exam?
85.5
90
9
95.5
none of these

A least-squares regression line for predicting weights of basketball players on the basis of their heights produced the residual plot below. What does the residual plot tell you about the linear model?
A residual plot is not an appropriate means for evaluating a linear model.
The curved pattern in the residual plot suggests that there is no association between the weight and height of basketball players.
The curved pattern in the residual plot suggests that the linear model is not appropriate.
There are not enough data points to draw any conclusions from the residual plot.
The linear model is appropriate, because there are approximately the same number of points above and below the horizontal line in the residual plot.
For children between the ages of 18 months and 29 months, there is an approximately linear relationship between height and age. The relationship can be represented by ŷ = 64.93 + 0.63x, where y represents height (in centimeters) and x represents age (in months).
Joseph is 22.5 months old. What is his predicted height?
50.8
64.96
65.96
79.11
87.4
A researcher studied the relationship between family income and amount of money spent
on an automobile. She calculated that
R2 = 45%. Which is the correct interpretaion?
45% of the price of the car can be predicted by using income.
The probability of predicting the correct price of a car is 45%.
45% of the variability in car price can be explained by using income.
The car price fluctuates 45% more than income.
None of these

Computer output in the scenario described in problem #8 reports that s = 2.3. Which is the
correct interpretation of this value?
The slope of the regression line is $2.30 per light.
The slope of the regression line is 2.3 lights per dollar.
The correlation is 2.3.
The initial cost, even with no lights is $2.30
The average prediction error of the regression line is $2.30.
How many ways can 13 gymnasts finish in 1st, 2nd, and 3rd place?
39
256
1716
2197
How many ways can ten students fill the student government positions of president, vice president, secretary, treasurer, and communications officer?
50
252
30,240
100,000
A test has 10 questions altogether. There are 6 multiple choice questions with 4 choices each and 4 true/false questions. If you only mark one response for each question, how many ways could the test be answered?
960
192
65536
151,200
How many distinct permutations can be made from the letters in the word MULTIPLY? Enter your response without commas.
(a)
100 students are participating in a science fair where a gold, silver, and bronze medal will be awarded. How many ways can these top 3 places be filled?
300
161,700
970,200
1,000,000
How many distinct permutations can be made from the letters in the word GRADUATE? Enter your response without commas.
(a)
How many distinct permutations can be made from the letters in the word COMPASSIONATE? Enter your response without commas.
(a)
How many distinct permutations can be made from the letters in the word REMEMBER? Enter your response without commas.
(a)
How many passwords could be made with these requirements: 4 numbers that can be repeated and 4 CASE SENSITIVE letters that cannot be repeated.
3,588,000,000
4,569,760,000
6.4974×10¹⁰
7.3116×10¹⁰
How many distinct permutations can you make from the letters in the word CUSTOMIZABLE? Enter you response without commas.
(a)
How many distinct permutations can you make from the letters in the word SLEEVELESS? Enter you response without commas.
(a)
Find the value of 100!÷99!
99
100,000,000
100
9,999,999
To earn a B in a science course, a student must complete and report on at least 8 of 10 experiments. In how many ways can this be done?
2
45
18
54
A pizza shop offers a special of any 3 toppings for a fixed price. if there are 8 toppings on the menu, how many choices does the special offer?
32
24
48
56
79!81!
Cannot be determined
2,162,160
6480
1
A lock has four dials. On each dial are the digits 0 to 9. How many possible 4-digit codes are possible if: the last digit must be even, and no repetitions are allowed?
2520
5040
6561
10,000
A recent study of 200 nurses found that of 125 female nurses, 56 had bachelor's degrees: and of 75 male nurses, 34 had bachelor's degrees. If a nurse is selected at random, find the probability that the nurse selected is a male nurse or does not have a bachelor's degree.
144/200
41/200
110/200
41/110
P(A) = .4 P(B) = .55 P(A and B) = .3 Find P(A or B)
47/100
11/20
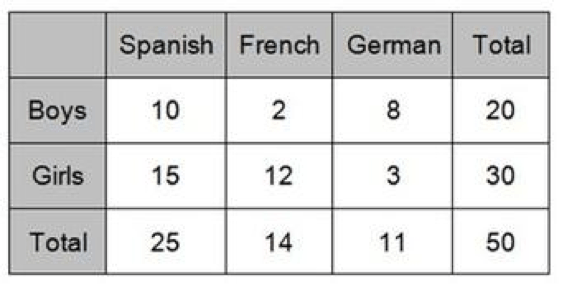
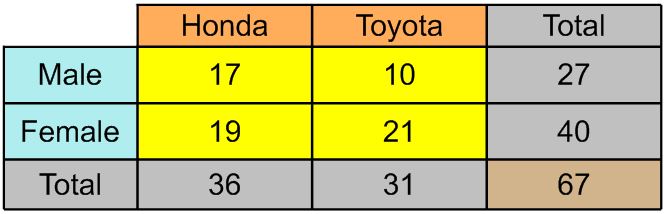
A box contains 5 purple marbles, 3 green marbles and 2 orange marbles. Draws are made without replacement. What is the probability you draw 2 purple marbles?
1/4
An unprepared student takes a 3-question true/false quiz in which he guesses the answers to all 3 questions. What is the probability he gets all 3 correct?
1/2
1/3
1/6
1/8
.675
.533
1.48
A new credit card has been issued to 2000 customers. Of these customers, 1500 hold a Visa, 500 hold an AA card, and 40 hold a Visa and AA card. Find the probability that a random chosen customer holds an AA, given they hold a Visa.
.0267
.25
.08
.02
A new credit card has been issued to 2000 customers. Of these customers, 1500 hold a Visa, 500 hold an AA card, and 40 hold a Visa and AA card. Find the probability that a random chosen customer holds a Visa, given they hold a AA.
.0267
.25
.08
.02
Jacob and Eugene are planning trips to four countries this year. There are 14 countries they would like to visit. One trip will be one week long, another two days, another two weeks, and the other a month. How many possibilities do they have?
24024
20876
1001
4804
A group of 20 people are going to run a race. The top 9 finishers advance to the finals. How many different possibilities are there?
83980
819782656
167960
335920
When flipping a coin many times, the probability of flipping heads in the long-run approaches:
5%
25%
50%
100%


the odds of failure
the list of all total possible outcomes
the chance of winning in the short run
the percent of times a desired outcome occurs after many many repetitions of a chance process.


True.
False.
Cannot be determined
50% chance
True.
False.
Cannot be determined
50% chance
Rolling an odd number and rolling an even number on a normal six-sided die are
Mutually exclusive
Not mutually exclusive


When rolling a single die, the events of rolling an even number and rolling a ‘5’ are ...
Mutually Exclusive
Not Mutually Exclusive
If a spinner is numbered 1 – 8, when you spin it the events of spinning an even number and a number less than 4 are ...
Mutually Exclusive
Not Mutually Exclusive
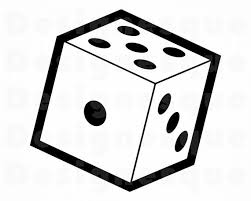
The chance of rolling a 2 is 1/6. What is the chance of not rolling a 2?
2/6
1/6
5/6
Not possible
If events A and B are mutually exclusive, what is P(A and B)?
0.50
0
1
0.75
A day of the week is chosen at random. What is the probability of choosing a Monday or Tuesday?
1/7
2/14
2/7
None of the above

In a landfill, there is a 27% chance that a piece of trash is recyclable plastic, a 54% chance that the item is biodegradable, and a 9% chance that the item is neither of these things. Pick of piece of trash at random. What is the probability that it is recyclable plastic or biodegradable?
81%
21%
54%
63%

In a pet store, there are 6 puppies, 4 kittens, and 7 parakeets. If a pet is chosen at random, what is the probability of choosing a puppy or a parakeet?
11/17
13/17
10/17
None of the above
Edith plants a daffodil bulb. The probability that the bulb will grow is 0.8.
What is the probability that the bulb will not grow?
0.8
0.2
0.4
0.6

A raffle is being drawn for a hot air balloon ride. 700 tickets are sold and you buy 5. What is the probability that you DO NOT win?
7005
700695
700699
7001
U and V are mutually exclusive events. P (U ) = 0.26; P(V ) = 0.37.
Find P(U AND V)
(a)

The height (in feet) and volume (in cubic feet) of usable lumber of 32 cherry trees are measured by a researcher. The goal is to determine if volume of usable lumber can be estimated from the height of a tree. In this study, the explanatory variable is......
height of researcher
volume of lumber
height of tree
the measuring instrument used to measure volume
impossible to determine
A lock has four dials. On each dial are the digits 0 to 9. How many possible 4-digit codes are possible if: the last digit must be divisible by 3, and no repetitions are allowed?
2016
5040
6561
10,000
A lock has four dials. On each dial are the digits 0 to 9. How many possible 4-digit codes are possible if: the last digit must be divisible by 4, and no repetitions are allowed?
2016
5040
1512
10,000


