
 Worksheets
QUIZ CORRELATION ANALYSIS AND REGRESSION
Total questions: 50
Worksheet time: 2hrs 43mins
The slope of the regression line of Y on X is also called the:
Correlation coefficient of X on Y
Correlation coefficient of Y on X
Regression coefficient of X on Y
Regression coefficient of Y on X
If one regression coefficient is greater than one, then other will be:
More than one
Equal to one
Less than one
Equal to minus one
The regression equation always passes through:
(X, Y)
(a, b)
(X̅ ,ȳ)
(X̅, Y)
When two regression coefficients bear same algebraic signs, then correlation coefficient is:
Positive
Negative
According to two signs
Zero
The value of the coefficient of correlation r lies between:
0 and 1
-1 and 0
-1 and +1
-0.5 and +0.5
If the regression line is X on Y, then the variable X is known as
a)Dependent variable
b)Explained variable
Both a and b
Regressor
If the correlation coefficient between two variables, X and Y, is negative, then the regression coefficient of Y on X is
Positive
Negative
Not certain
None of these

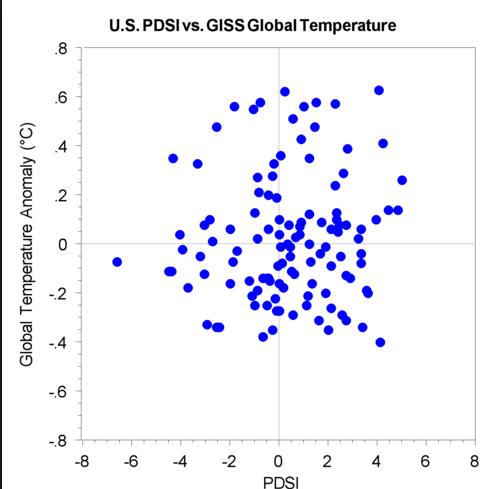
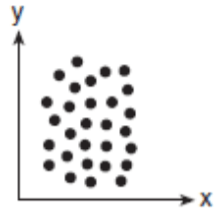
Describe the correlation in the graph shown.
A) Strong Negative
B) Strong Positive
C) Weak Negative
D) No Correlation

Estimate the correlation coefficient for this scatterplot.
A) r = 1.2
B) r = 0.89
C)r = 0
D) r = -0.89

Estimate the correlation coefficient for this scatterplot.
A) r = -0.9
B) r = 1
C) r = 0.9
D) r = -1
As x increases, y decreases.
A) no correlation
B) negative correlation
C) correlation coefficient
D) positive correlation
As x increases, y increases
A) correlation coefficient
B) causation
C) positive correlation
D) negative correlation
The range of a function is:
the domain
the x-values
the algebra values
the y-values
If x is temperature and y is coffee sales, use the following formula to determine the coffee sales on a 34° day.
y = -60x+6443
$4403
$4673
$8483
$6443
What is the y-intercept in the following equation: y= -5 - 4x?
-4
-4x
5
-5
What is the slope in the following equation: y= 6 - 2/3x?
2/3
6
-6
-2/3
What is a correlational research?
relationship and difference between variables
relationship between variables
significant difference
cause and effect relationship
weight and height of students
POSITIVE
NEGATIVE
ZERO
number of customers and sales in a department store
POSITIVE
NEGATIVE
ZERO
amount of rainfall and amount of agricultural harvest
POSITIVE
NEGATIVE
ZERO
area and length of a side of a square
POSITIVE
NEGATIVE
ZERO
sense of humor and shoe size of persons
POSITIVE
NEGATIVE
ZERO
What happens to variable X and Y when they are positively correlated?
X decreases as Y increases
X decreases as Y decreases
X increases as Y decreases
X increases as Y increases
income and educational attainment of employees
POSITIVE
NEGATIVE
ZERO
If there is perfect correlation between two variables then correlation coefficient must be
greater than 1
less than 1 but greater than zero
zero
one
What is coefficient of correlation used for?
particular value of one variable given the particular value of other variable.
the strength of relationship between two variables.
Both are correct
None of the above

This is an example of...
Positive Correlation
Strong Negative Correlation
No correlation
Weak negative correlation
If change in one variable results a corresponding change in the other variable, then the variables are.........................
a. Correlated
b. Not correlated
c. Any of the above
d. None of the above
Coefficient of correlation lies between:
a. 0 and +1
b. 0 and –1
c. –1 and +1
d. – 3 and +3
If the ratio of change in one variable is equal to the ratio of change in the other variable, then the correlation is said to be .....................
a. Linear
b. Non-linear
c. Curvilinear
d. None of these
If r= +1, the correlation is said to be ...................
a. High degree of +ve correlation
b. High degree of –ve correlation
c. Perfect +ve correlation
d. Perfect –ve correlation
Coefficient of correlation explains .........................of the relationship between two variables.
a. Degree
b. Direction
c. Both of the above
d. None of the above
Which value of r represents data with a strong negative linear correlation between two variables?
-1.87
-0.89
-0.14
-0.05
Which value of r represents data with a moderate linear correlation between two variables?
0.89
0.45
1.07
0.09
Linear regression analysis produces an equation of Y = 7 - 3.2X. This indicates that:
An X value of 0 would would increase Y by 7.
A 1 unit decrease in X results in a 3.2 unit decrease in Y.
A 1 unit increase in X results in a 3.2 unit increase in Y.
A 1 unit increase in X results in a 3.2 unit decrease in Y.
If the least-squares equation is y = 5 + 2x, then an increase of 1 unit in x is associated with an increase of 2 units in y.
True
False
For a regression equation y = 24 -0.3x, the coefficient of correlation should be
negative.
True
False
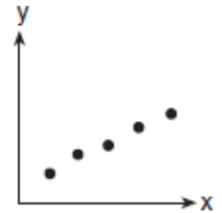
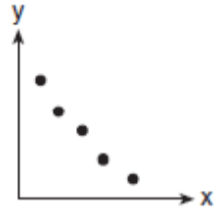
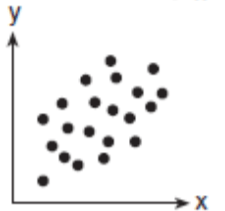
Which scatter plot diagram shows the strongest positive correlation?
If r=0, there is a strong correlation.
True
False
If r=0 , then there is...
Negative association
No correlation
Positive association

