
 Worksheets
Demand curves
Total questions: 15
Worksheet time: 8mins
The law of demand argues that as prices rise
the quantity demanded will fall
the quantity demanded will rise
the demand curve will shift to the right
quantity demanded will fall due to a decrease in demand

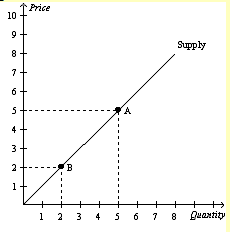

1. Study the demand curves below. If the price of a slice of pizza decreased from $4.00 to $2.00, how would that change the number of slices of pizza demanded each day by the market?
a. The demand would increase by 2 slices per day.
b. The demand would decrease by 2 slices per day.
c. The demand would increase by 100 slices per day.
d. The demand would decrease by 100 slices per day.
Graphic representation of a demand schedule is called
Demand Curve
Supply Curve
Chart
Graph
The amount of goods that would be purchased at a particular price is represented by a
Demand Schedule
Demand Curve
Supply Schedule
Supply Curve
Movement along the demand curve is called
Change in Quantity Demanded
Change in Demand
Change in Quantity Supplied
Change in Supply
A shift in the demand curve can be causes by
Consumer Expectations
Income Effect
Inferior Goods
Substitution Effect
Things you buy to try to save money are known as
Inferior Goods
Brand name Products
Wants
Needs
A shift in the entire demand curve is known as
Change in Demand
Change in Quantity Demanded
Change in Supply
Change in Quantity Supplied
Goods that are used in conjunction with each other are called
Complementary Goods
Substitutes
Inferior Goods
Bargains

