
 Worksheets
U3: Target 14: Reading Heating /Cooling Curves
Total questions: 22
Worksheet time: 21mins

The graph shows the heating curves for benzene and water.
Which substance has a higher boiling point?
benzene
water

Given the heating curve of a solid being heated at a constant rate, how much total time was required to boil this substance after it reached its melting point?
3 minutes
4 minutes
10 minutes
14 minutes

Given the heating curve for water, during which line segment could I find water in both the solid and liquid phase at the same time?
AB
BC
CD
DE
EF


Given the heating curve of a solid being heated at a constant rate, how long it is in the liquid phase only?
3 minutes
5 minutes
10 minutes
2 minutes

What label is given to the first flat line on the graph?
temperature
boiling point
melting point
time

At the first flat line on the graph, what state of matter should we see?
mix of solid and liquid
mix of liquid and gas
mix of solid and gas
solid
What label is given to the second flat line on the graph?
temperature
boiling point
melting point
time
At the second flat line on the graph, what state of matter should we see?
solid
liquid
gas
mix of liquid and gas
The temperature of this substance is always increasing on this graph.
true
false
Thermal energy is always being added on this graph.
true
false

At the first flat line on the graph, what state of matter should we see?
mix of solid and liquid
mix of liquid and gas
mix of solid and gas
gas

What label is given to the second flat line on the graph?
temperature
boiling point
melting point
time

At the second flat line on the graph, what state of matter should we see?
solid
liquid
mix of solid and liquid
mix of liquid and gas

Thermal energy is always being removed on this graph.
true
false
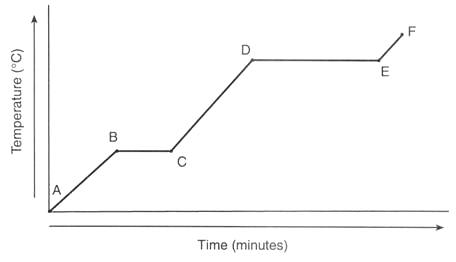
Between which points is the temperature of the substance remaining constant?
A-B only
A-B, C-D, and E-F
B-C only
B-C and D-E

In which region(s) does temperature increase?
Region C only
Regions B and D
Regions A, C, and E
Regions A and B

Describe the substance at letter E


During a phase change, the temperature ________.
increases
stays the same
decreases
If temperature decreases, the average kinetic energy ________.
increases
stays constant
decreases

This curve indicates what about the heat energy?
Heat energy is being added or absorbed
Heat energy is being released

