wayground logo

Free Printable Worksheets

Font size

S
M
L
XL
Worksheets

DATA * STATISTICS-7PLUS

Total questions: 111

Worksheet time: 6hrs 33mins

Name
Class
Date
1.

_________ is a sample in which each individual or object in the entire population has an equal chance of being selected.

a)

Sample

b)

Population

c)

Random Sample

d)

Quartile

2.
_______ is the entire group of objects or individuals considered for a survey.
a)
Sample
b)
Population
c)
Random Sample
d)
Quartile
3.

Identify the Population:

Cherokee County Schools randomly selected 230 teachers to find out which technology resource its teachers feel is the most effective. What is the population in this situation?

a)

230 Teachers

b)

All Cherokee County teachers

c)

All Cedar Bluff teachers

d)

All Sand Rock and Spring Garden students

4.
What would be the population in this example?
Surveyors in a mall choose shoppers to ask about products they prefer.
a)
the surveyors
b)
all shoppers in the mall
c)
the shoppers who were asked their preferences
5.
A school surveys all 7th grade boys to determine what to sell in the school store.  This sample is _________.
a)
Biased
b)
Unbiased
c)
Representative
d)
Peanut butter cups
6.
A school survey asked 50 girls to identify their favorite items on the school cafeteria menu. This sample is ________________.
a)
Biased
b)
Unbiased
c)
Representative
d)
Numerical
7.
A student wants to know which type of pizza the students at his high school prefer. Which option would give a unbiased, representative sample:
a)
Asking all the students in the hot lunch line.
b)
Asking 10 random students from each homeroom.
c)
Asking every other student who gets off a school bus.
d)
Asking all the 10th graders.
8.
_______ is a part of a group being surveyed.
a)
Sample
b)
Population
c)
Random Sample
d)
Quartile
9.

Interview every 10th student who enters the school in the morning.

a)

simple random

b)

voluntary response

c)

systematic

d)

convenience

10.

Marianne wanted to know students' opinion on the new schedule at school. She survey's the first 30 students who come into her class.

a)

Convenience Sampling

b)

Systematic Random Sampling

c)

Simple Random Sampling

d)

Volunteer response

11.
A ___ is a small portion of the population used to gather data from.
a)
Systematic Sampling Method
b)
Sample
c)
Population
d)
Bias
12.

What type of sampling is shown here?

a)

Simple Random Sample

b)

Systematic Sample

c)

Cluster Sample

d)

Stratified Sample

13.
Why do we randomly select our samples?
a)
for control
b)
reduce bias
c)
so we don't get the same answers from everyone
d)
to eliminate confounding results
14.

This is the most basic method of drawing a probability sample.

a)

stratified sampling

b)

systematic sampling

c)

random sampling

d)

conveniene sampling

15.

Which measure of central tendency is most affected by outliers?

a)

Mean

b)

Median

c)

Mode

16.

To evaluate the defect rate of its memory chips, an integrated circuit manufacturer tests every 100th chip off the production line.

a)

Biased Sample

b)

Unbiased Sample

17.

A real estate agent surveys people about their housing preferences at an open house for a luxury townhouse.

a)

Biased Sample

b)

Unbiased Sample

18.

Airline boarding passes are marked with red stars at random to decide which passengers should have their carry-on luggage inspected.

a)

Biased Sample

b)

Unbiased Sample

19.

To determine how often people eat out, every tenth person entering a Chinese restaurant is surveyed.

a)

Biased Sample

b)

Unbiased Sample

20.

Carlos wants to know the favorite sport of people at his school so he asks his baseball team.

a)

Biased

b)

Unbiased

21.

A public library asked every 10th person who entered to name the type of book they were getting.

a)

Biased

b)

Unbiased

22.
3.  A hospital wants to open a gym. They ask the night-shift ER staff when they would use the gym.
a)
Biased
b)
Unbiased
23.

To see who has a computer at home the front office chooses 10 students randomly per grade to ask.

a)

Biased

b)

Unbiased

24.

What is the range?

a)

The sum of the largest and smallest number

b)

The number in the middle

c)

The difference between the largest and smallest number

d)

The number that appears most often

25.

What is the median?

a)

The number in the middle when the numbers are in order from least to greatest.

b)

The difference between the largest and smallest number.

c)

The average

d)

The number that appears most often.

26.
What is the mode?
a)
The average
b)
The number that appears most often.
c)
The largest number - the smallest number
d)
The number in the middle.
27.
To find the average of a set of numbers, add up all the items and divide by...
a)
2.
b)
The smallest number
c)
The largest number
d)
The number of items in the set.
28.
A data set can have more than one mode
a)
True
b)
False
29.
When you are trying to find the MEDIAN of a set of data and 2 numbers are left in the middle after putting them in order from least to greatest, what do you do?
a)
List both of the numbers as the Median.
b)
Add the two numbers together and divide by 2.
c)
Pick the one that you want.
d)
Subtract the two numbers.
30.
Roger bowled 7 games last weekend. His scores are: 155, 165, 138, 172, 127, 193, 142. What is the range of Roger's scores?
a)
193
b)
127
c)
60
d)
66
31.
The mode score on the 6th grade math test was 94! Which of these interpretations must be correct?
a)
99 was the highest score on the test.
b)
More students received a 94 than any other score
c)
No student scored below a 50
d)
A score of 91 was slightly below average.
32.

The number of miles that Jenna cycled each week for a 7-week period is shown:

36, 42, 28, 52, 48, 36, 31

What is the median number of miles Jenna cycled?

a)

24

b)

39

c)

36

d)

52

33.
In order to find the median, the data must be sorted from least to greatest first.
a)
True
b)
False
34.

At Donald's Donuts the number of donut holes in a bag can vary. Help Donald find the MODE.

12,10,10,10,13,12,11,13,10

a)

10

b)

12

c)

10 and 12

d)

No Mode

35.

What is the MEDIAN of this set of data?

10, 90, 80, 60, 50, 40, 70, 30, 20, 100

a)

50

b)

60

c)

55

d)

45

36.
6. Find the mean.
18, 2, 0, 0, 0
a)
4
b)
5
c)
10
d)
20
37.
The heights of some students are given.
158cm     172cm      164cm
164cm     167cm      159cm
 What is the range of the heights?
a)
13cm
b)
14cm
c)
164cm
d)
330cm
38.
Find the median.
7, 1, 1, 7, 1, 4, 1
a)
4
b)
7
c)
1
d)
5
39.
Find the mode.
7, 1, 1, 7, 1, 4, 1
a)
7
b)
3
c)
1
d)
4
40.
Find the range.
7, 1, 1, 7, 1, 4, 1
a)
6
b)
5
c)
7
d)
3
41.

Which central measure of tendency indicates the data point that occurs most frequently?

a)

Mean

b)

Median

c)

Mode

d)

Range

42.

Which central measure of tendency indicates the data point that is the middle of the set?

a)

Mean

b)

Median

c)

Mode

d)

Range

43.

Which central measure of tendency indicates the average of a data set?

a)

Mean

b)

Median

c)

Mode

d)

Range

44.

What is the mean of the following data set?


12, 5, 7

a)

8

b)

7

c)

5

d)

12

45.

What is the median of the following data set?


12, 5, 7

a)

8

b)

7

c)

5

d)

12

46.

What is the mode of the following data set?


12, 5, 7

a)

8

b)

7

c)

5

d)

No Mode

47.

What is the mean of the following data set?


4, 13, 10, 9, 4

a)

8

b)

10

c)

7

d)

9

48.
The number of pages that Carolyn wrote in her journal each day from Monday to Friday is shown below: 
9, 8, 12, 6, 10
What is the mean number of pages she wrote per day?
a)
5
b)
6
c)
9
d)
11
49.
The median is
a)
The middle score
b)
 Scores added & divided by the number of scores
c)
The most frequent score
d)
The middle when in order
50.
Which car club has the higher median?
a)
Cruisers
b)
Car Hops
51.
How many students had more than 6 candy bars?
a)
5
b)
2
c)
3
d)
1
52.
How many people had 3 pets?
a)
5
b)
7
c)
4
d)
3
53.
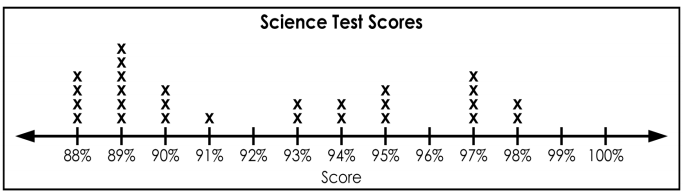
What is the highest score in the class?
a)
88%
b)
100%
c)
13
d)
98%
54.

What is the mode of the data shown?

(a)  

55.

How many students scored 8 points or higher on the quiz?

(a)  

56.

What is the range of the data shown?

(a)  

57.

On a survey, a teacher asked others the number of children they had in their family. Ms. Hederick plotted the number of children in on the given dot plot. How many people had at least 3 children in their family?

a)

5

b)

10

c)

9

d)

8

58.
What is the minimum in this data set?
a)
0
b)
4
c)
9
d)
40
59.
How many scores are listed in this Stem and Leaf Plot?
a)
3
b)
6
c)
9
d)
18
60.
What is the highest quiz grade in the stem and leaf plot?
a)
9
b)
26
c)
92
d)
96
61.
How many baseballs were thrown 50 or more feet?
a)
5
b)
4
c)
13
d)
8
62.
What is the median of the Stem-and-Leaf Plot?
a)
43.5
b)
42
c)
45
d)
44.5
63.

What is the Mode of this data?

a)

96

b)

97

c)

68

d)

802

64.

What is the Mode of this data?

a)

74

b)

56888

c)

68

d)

45

65.

How many data items are on this plot?

a)

9

b)

17

c)

26

d)

89

66.

Find the Median?

a)

95

b)

97.2

c)

96.8

d)

98

67.

This is the test scores for two different classes. Which class has a greater mode?

a)

2009 class

b)

2010 class

c)

neither

d)

Same

68.

Which has a higher median?

a)

Florida

b)

Texas

69.
What value is the lower quartile?
a)
66
b)
58
c)
60
d)
64
70.
What is the median?
a)
62
b)
58
c)
66
d)
60
71.
What is the interquartile range (IQR)?
a)
4
b)
64
c)
60
d)
8
72.
Which box and whisker plot has the highest median?
a)
Top plot
b)
Bottom plot
73.
Which restaurant has a higher median wait time?
a)
Lucy's Steakhouse
b)
Gary's Grill
c)
They are the same
74.

What is the interquartile range (IQR)?

a)

20

b)

25

c)

30

d)

50

75.
What data value is the upper quartile (Q3)?
a)
64
b)
62
c)
66
d)
58
76.

Which person has the higher upper extreme and what is that number?

a)

Irene, 90 minutes

b)

Janelle, 80 minutes

c)

Irene, 80 minutes

d)

Janelle, 70 minutes

77.

What percent of the data is below 80?

a)

0%

b)

25%

c)

50%

d)

75%

e)

100%

78.
What percent of students have a height between 58 inches and 60 inches?
a)
25%
b)
50%
c)
75%
d)
100%
79.
What percentage of the data is between 90 and 140?
a)
25 %
b)
50%
c)
75%
d)
100%
80.

What is the upper quartile of the set of data; 2, 4, 6, 6, 7, 8, 10

a)

4

b)

6

c)

8

d)

2

81.

The first step in creating a box-plot with a data set is to...

a)

find the mean

b)

list the numbers from least to greatest

c)

find the middle

d)

draw a rectangle

82.

Each part of a box plot represents...

a)

25% of the data

b)

33% of the data

c)

20% of the data

d)

10% of the data

83.

Which of the following can NOT be determined when looking at a box-plot?

a)

median

b)

the lowest number

c)

mean

d)

the range (largest value minus the smallest value)

84.

Find the median of these numbers:

2, 3, 4, 5, 5, 5, 7,

a)

3

b)

4

c)

5

d)

6

85.

Find the median.

5, 5, 9, 12,18, 22, 25,

a)

9

b)

10

c)

12

d)

13

86.

Find the Quartile 1.

5, 5, 9, 12,18, 22, 25,

a)

18

b)

12

c)

9

d)

5

87.

What is the upper quartile (Q3) of the set of data:

2, 4, 6, 6, 7, 8, 10

a)

2

b)

6

c)

4

d)

8

88.

What is the lower Quartile (Q1) of the set of data:

2, 4, 6, 6, 7, 8, 10

a)

2

b)

6

c)

4

d)

8

89.

What is the value of the lower quartile (Q1)?

a)

3

b)

8

c)

10

d)

15

90.

What is the value of the upper quartile (Q3)?

a)

3

b)

8

c)

10

d)

15

91.

What is the median?

a)

3

b)

8

c)

10

d)

15

92.
Which value is in the top 25% of the data?
a)
16
b)
22
c)
29
d)
36
93.
Which box and whisker plot has the smallest lower quartile (Q1)?
a)
Top plot
b)
Bottom plot
94.
Which plot has a larger interquartile range?
a)
Top plot
b)
Bottom plot
95.
Which box and whisker plot has the highest median?
a)
Top plot
b)
Bottom plot
96.

Which data set shows a greater spread?

a)

Chess Club

b)

Checkers Club

c)

They have the same spread.

d)

You cannot tell from the box plots.

97.
What is the outlier?
16,17,18,19, 20, 24, 31, 33, 36, 62
a)
62
b)
16
c)
24
d)
20
98.
The entire set of people or objects that is being studied.
a)
Population
b)
Sample
c)
Sampling Plan
d)
Data Point
99.
The data point that occurs most often in a set of data.
a)
Mean
b)
Median
c)
Mode
d)
Range
100.
The number that is in the middle of a set of data ordered from smallest to largest.
a)
Mean
b)
Median
c)
Mode
d)
Range
101.
The difference of the maximum and minimum data points in a set.
a)
Mean Absolute Deviation
b)
Range
c)
Mean
d)
Absolute Value
102.
A group of people or objects selected from a population.
a)
Population
b)
Sample
c)
Sampling Plan
d)
Data Point
103.
Which of the following would be the BEST definition for the word INFERENCE?
a)
making a guess about something
b)
a conclusion reached on the basis of evidence AND reasoning
c)
creating false presumptions
d)
summarizing a portion of text
104.
Find the Mean Absolute Deviation:  10, 9, 3, 8, 10.  The Mean is 8
a)
3
b)
5
c)
1
d)
2
105.

What is the second step to solving for the Mean Absolute Deviation?

a)

Find the mean of the new set of numbers

b)

Find the mean of the given data set

c)

Subtract the mean from each original data point

106.

What is the last step to solving for the Mean Absolute Deviation?

a)

Find the mean of the new set of numbers

b)

Find the mean of the given data set

c)

Subtract the mean from each original data point

107.

What is the first step to solving for the Mean Absolute Deviation?

a)

Find the mean of the new set of numbers

b)

Find the mean of the given data set

c)

Subtract the mean from each original data point

108.

What is the definition of the Mean Absolute Deviation?

a)

A data set is the average distance between each data value and the mean

b)

The average of the numbers

c)

The difference between the lowest and highest values

d)

The "middle" value in the list of numbers

109.

True or false?:The absolute value of a number will always be positive.

a)

True

b)

False

110.

What is Mean Absolute Deviation?

a)

The mean of the data

b)

The absolute value of the mean

c)

The variation of data values around the mode

d)

The average distance between the data values and the mean

111.
What is another word for average?
a)
Mean
b)
Median
c)
Mode
d)
Range