
Font size
 Worksheets
Statistics Review
Total questions: 47
Worksheet time: 2hrs 27mins
How do you find the median of a data set that has two middle numbers?
You pick the higher middle number
You pick the lower middle number
Add the two middle numbers and divide it by 2
Subtract the two middle numbers and divide by 2

Which measure of center would best represent this data?
Mean
Median
Mode
Mean OR median

Which measure of central tendency best represents this data?
Mean
Median
Mode
Mean OR median
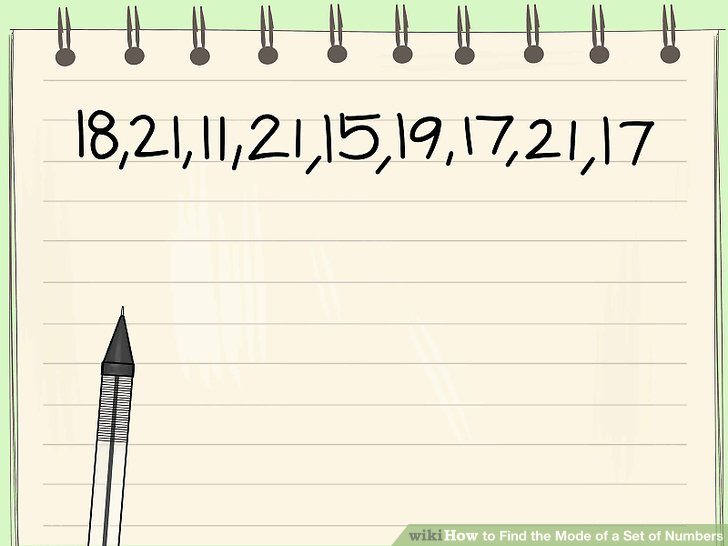
The mean of this data set is 17.8. What would happen to the mean if 40 was added to the data set?
The mean would not change
The mean would go up
The mean would go down

Which class has the higher median?
1st period
2nd period
They have the same median

Which class did better on the test?
1st period
2nd period
They both performed the same

How is the data distributed in this histogram?
Symmetrically
Skewed Right
Skewed Left

How is the data distributed in this histogram?
Symmetrically
Skewed Right
Skewed Left

20 30 40 50 60
3, 5, 7, 9, 11, 8, 3
median:9 mode:3 range:8
median:6 mode:3 range:7
median:7 mode:3 range:8
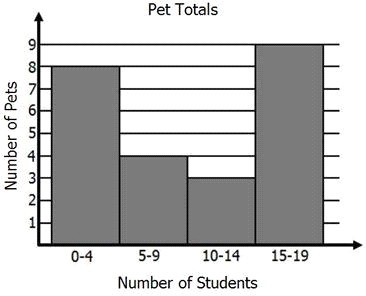


Calculate the RANGE for the data set: 6, 7, 12, 8, 7, 4, 8, 8, 7
7
7.44
8
7 and 8
What is the third quartile of the data?
What is the first quartile of the data?
What is the interquartile range of the data?


What percentage of the data is between 90 and 140?
25 %
50%
75%
100%

What percentage of the data is between 40 and 90?
25 %
50%
75%
100%

What percent of the data is between 30 and 35 on the number line?
25%
50%
75%
100%
What is the median of this data?
40
90
100
140
150


Which has a greater spread (range)
Science
Math

Which chapter was more difficult for students?
chapter 9
chapter 10
12, 13, 11, 16, 31, 14, 10, 15
What measure of center is best to use when we have outliers?
mean
median
mode
range
4,2,5,6,3
158cm 172cm 164cm
164cm 167cm 159cm
What is the range of the heights?

What is the standard deviation for the data given:
5, 10, 7, 12, 0, 20, 15, 22, 8, 2
6.89
10.1
7.26
9
What is the standard deviation for the data population given:
{12, 13, 29, 18, 61, 35, 21}
293.67
15.87
17.14
41.98
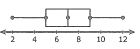
Given that the data is symmetric, which pair of measures should be used to represent the data?
center: median
spread: standard deviation
center: mean
spread: IQR
center: mean
spread: standard deviation
center: median
spread: IQR

Which measure of spread should be used to describe the distribution?
standard deviation
interquartile range
range
median

What is the shape of the distribution?
symmetric
uniform
skewed to the right
skewed to the left

Because this distribution is ____________ to the ___________, we would use the ______________ for the center and the _____________ for the spread of the data.
symmetric, middle, median, IQR
skewed, left, median, IQR
skewed, left, mean, IQR
skewed, right, median, standard deviation
Check all that apply:
The IQR is the
max - min
Interquartile Range
measure of spread that pairs with the mean
Q3 - Q1
88, 92, 92, 96, 98
Gabriella scored a 20 on her sixth quiz. What effect does this score have?
2, 5, 12, 15, 19, 4, 6, 11, 16, 18, 12, 12, 42
What effect does removing the outlier have on the distribution of the data?

