
 Worksheets
REVIEW: Modeling Motion
Total questions: 226
Worksheet time: 3hrs 22mins


This graph shows
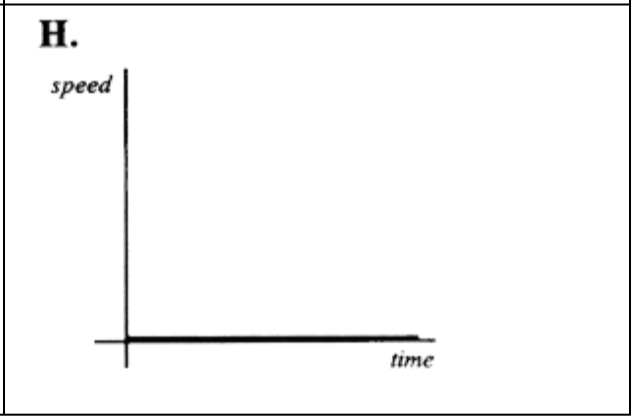
An object stopped
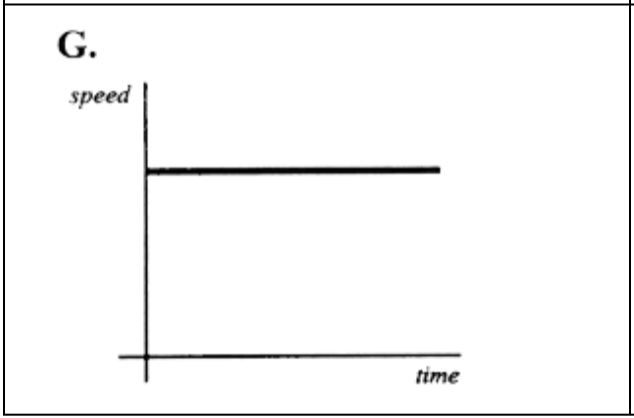
An object moving at constant speed
An object slowing down
An object speeding up
Mufasa lives 100 meters from his friend's house. What is his average speed if he reaches his friends house in 50 seconds?
Distance= 100 m
time = 50 seconds
1 m/s
2 m/s
3 m/s
4 m/s
d= 40 m
t= 5 s
If Mr. Deem is walking 3 m/s to the north and Mr. Silvio is walking 3 m/s to the west, then which of the following is true
They have the same speed and different velocities
They have the same velocity and different speeds
They have the same speed and velocity
They have different speeds and different velocities
If Mr. Deem is walking 3 m/s to the north and Mr. Silvio is walking 3 m/s to the west, then which of the following is true
They have the same speed and different velocities
They have the same velocity and different speeds
They have the same speed and velocity
They have different speeds and different velocities
Any change in SPEED or DIRECTION is referred to as _____.
Acceleration
Speed
Velocity
Motion


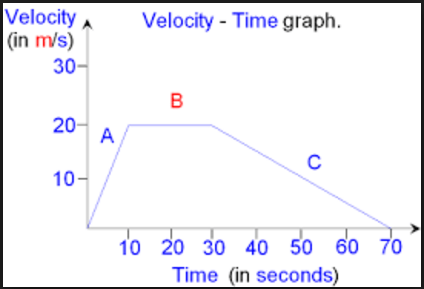
Which of the following describes the difference between speed and velocity?
Speed describes an object’s distance and direction while velocity describes an object’s distance.
Speed describes an object’s direction while velocity describes an object’s distance and direction.
Speed describes an object’s distance while velocity describes an objects distance and direction.
Speed describes and object’s distance and direction while velocity describes an objects direction.
Which of the following describes an object that is accelerating?
a person jogging in place
a bird slowing down as it lands
a car parked on the side of the road
your teacher reading a book out loud

This graph represents an object moving at a _________ speed, __________ from the reference point
increasing , away
constant , away
increasing , towards
constant , towards

In this graph, the object is
slowing down
speeding up
no moving
moving at a constant speed

In this graph, the object is ___________.
slowing down
speeding up
moving at a constant speed
no moving
A school bus leaves school and heads east for 2 miles before making its first stop. It then turns left and heads north 3 miles before making another stop. What is the total distance traveled by the school bus?
3 miles
5 miles
1 mile
3.61 miles
If you were told to accelerate while driving you could....
(Check all the correct answers.)
change direction
stay at the same speed and direction
speed up
slow down
Check all that are forms of acceleration.
running at a constant speed around a track
cruising at 70 mph
coming to a stop at a stop sign
an airplane taking off

Describe the motion in the graph:
Constant Speed (positive slope)
Stopped (at rest)
Acceleration (increasing speed)
Return Home (negative slope)

Describe the motion in the graph:
Constant Speed (positive slope)
Stopped (at rest)
Acceleration (increasing speed)
Return Home (negative slope)
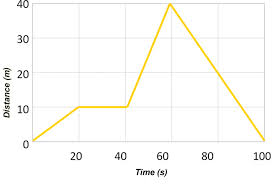
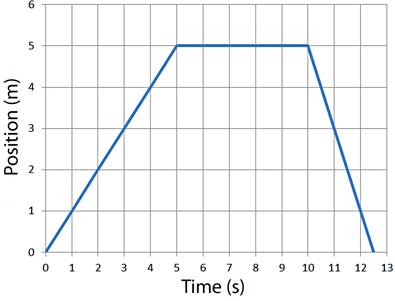
How long did it take this object to travel from the reference/starting point back to its reference/starting point?
Match the description to the graph:
"The car is coming back."


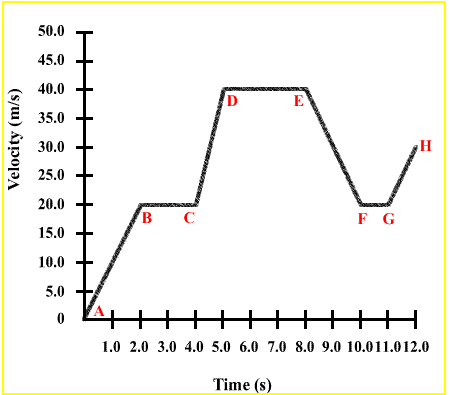
Segment B-C The bus is _________________.
at rest
returning (to original position)
moving forward
Match the description to the graph:
"The car is slowing down."
The bus is traveling _________ along Segment B-C than along Segment D-E
slower
faster
the same speed
A car goes from 0 mi/hr to 30 mi/hr in 20 sec. This is an example of
positive acceleration
negative acceleration
changing direction
A car goes from 30 mi/hr to 0 mi/hr in 20 sec. This is an example of
positive acceleration
negative acceleration
changing direction
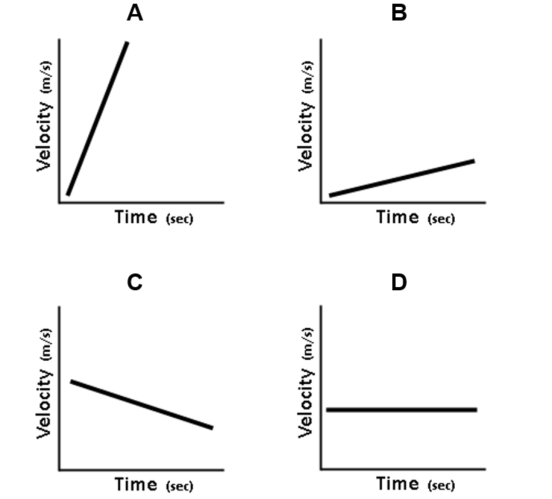
Which diagram describes an object moving at a constant speed?


These graphs both represent:
decreasing speed
constant speed
acceleration
object at rest


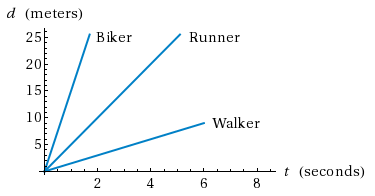
Which person moved the fastest in 3 seconds?
biker
runner
walker
they are all moving equally

How long did it take for this object to travel 10 m?
0 s
10 s
15 s
20 s

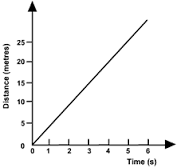
What is the line on this graph showing?
moving away from starting point at a constant speed
moving back towards the starting point at a constant speed
acceleration (getting faster)
deceleration (getting slower)
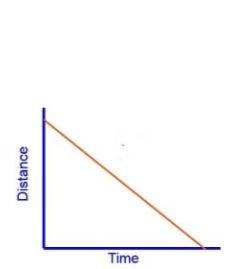
What is this line of this graph showing?
moving away from starting point at a constant speed
moving back towards the starting point at a constant speed
acceleration (getting faster)
deceleration (getting slower)
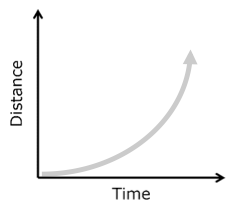

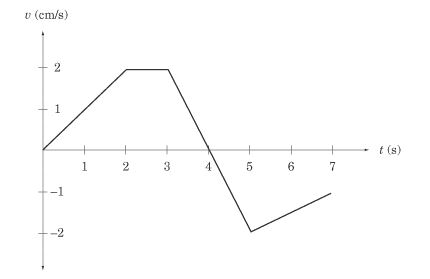
What is happening between 2 and 3 seconds?
The object is not moving.
The object is not accelerating.
The object is slowing down.
The object is speeding up.

This position vs. time graph shows an object...
not moving
moving with constant velocity
moving with changing velocity

This position vs. time graph shows an object...
not moving
moving with constant velocity
moving with changing velocity

This position vs. time graph shows an object...
not moving
moving with constant velocity
moving with changing velocity

This velocity vs. time graph shows an object...
(Hint: For this graph, the velocity is 0 m/s!)
not moving
moving with constant velocity
moving with changing velocity

This velocity vs. time graph shows an object...
not moving
moving with constant velocity
moving with changing velocity

This velocity vs. time graph shows an object...
not moving
moving with constant velocity
moving with changing velocity

This position vs. time graph shows an object...
not moving
moving with constant velocity
moving with changing velocity

This position vs. time graph shows an object...
not moving
moving with constant velocity
moving with changing velocity

This velocity vs. time graph shows an object...
not moving
moving with constant velocity
moving with changing velocity
Which of these position vs. time graphs shows an object changing direction?


Which of these velocity vs. time graphs shows an object changing direction?


This motion map shows an object...
not moving
moving with constant velocity
moving with changing velocity

This motion map shows an object...
not moving
moving with constant velocity
moving with changing velocity

This position vs. time graph shows an object...
speeding up
slowing down

This position vs. time graph shows an object...
speeding up
slowing down

The dot diagram represents the motion of a rightward-moving truck. What is the direction of the truck's acceleration?
Right
Left
The truck is not accelerating
Can not be deduced from the given information

The velocity-time table represents the motion of a bicycle. What is the direction of the bicycle's acceleration?
Left
Right
The bicycle is not accelerating
Not enough information

Velocity and time information for a rightward-moving car are shown.
What is the magnitude (i.e., value) and direction of the acceleration?
10 s2m
2 s2m
16 s2m
8 s2m

The velocity-time table represents the motion of a rightward-moving motorcycle. What is the magnitude (i.e., value) and direction of the acceleration?
2 s2m Right
2 s2m Left
4 s2m Right
4 s2m Left
A downward moving elevator is slowing down. What is the direction of the elevator's acceleration?
Down
Up
No acceleration
Not enough information
A cross-country skier moves 30 meters eastward, then 50 meters westward, and finally 20 meters eastward.
What is the magnitude and direction of the displacement?
100 m
100 m Eastward
No displacement
60 m Eastward

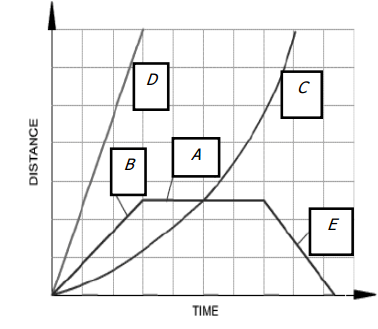
Five stages - labeled A, B, C, D, and E - of an object's motion are represented by the position-time graph below. During which stage(s) is the object moving towards its starting point?
A
B
C
D

The motions of Objects A, B, and C are represented on a position-time graph. Observe their lines and rank the speeds of Objects A, B, and C from slowest to fastest.
A, B, C
B, A, C
A, C, B
C, B, A
The velocity-time graphs represent the motion of four different objects. Identify any object that is stationary or not moving. Check all that apply.


The velocity-time graphs represent the motion of four different objects. Identify any object that is changing its velocity or accelerating. Check all that apply.


The velocity-time graphs represent the motion of four different objects. Identify any object that is getting faster or speeding up. Check all that apply.


The velocity-time graphs represent the motion of three different objects. Identify any object that is changing directions. Check all that apply.


None of the above
The velocity-time graphs represent the motion of four different objects. Identify any object that is moving in the + direction and speeding up. Tap on all that apply.


Select the description of motion from A - B.
Slowing down away from the origin
Speeding up away from the origin
Constant velocity away from the origin
Constant velocity towards the origin

What segment of the graph shows no motion, or standing still?
A - B
B - C
C - D
None

True or False: this graph shows several segments ALL with constant velocity.
True
False

Describe motion of C - D.
Constant velocity away from the origin
Slowing down away from the origin
Slowing down away from the origin and then slowing down towards the origin
Slowing down away from the origin and then speeding up towards from the origin

Describe the motion from B - C.
Standing still
Constant velocity of 60 m/min
Constant velocity of 0 m/min
Accelerating

What kind of line on a P-T graph would create the segment B - C on this V-T graph?
Straight, linear line
Horizontal line
Curved line
Wouldn't happen

Segment D - E would have come from what type of P-T graph line?
Straight, linear
Horizontal
Curved
Wouldn't happen
What does a horizontal line (not on the x-axis) mean on a V-T graph?
No movement
Constant velocity
Changing velocity
Change in direction

What is happening at 0 m/min in the middle of segment C - D?
Nothing is happening
Change in speed
Change in position
Change in direction

Which segment shows an object speeding up towards the origin?
A - B above the x-axis
C - D below the x-axis
C-D above the x-axis
D - E
To determine how far from the detector an object is located on a Position-time graph I should...
Look at the vertical axis at that time
Look at the steepness of the line (slope)
Look at if the slope is positive or negative
Look at the direction of the curvature, if any
To determine how fast an object is moving on a Position-time graph I should...
Look at the vertical axis at that time
Look at the steepness of the line (slope)
Look at if the slope is positive or negative
Look at the direction of the curvature, if any
To determine which way an object is moving on a Position-time graph I should...
Look at the vertical axis at that time
Look at the steepness of the line (slope)
Look at if the slope is positive or negative
Look at the direction of the curvature, if any
To determine which way an object is accelerating on a Position-time graph I should...
Look at the vertical axis at that time
Look at the steepness of the line (slope)
Look at if the slope is positive or negative
Look at the direction of the curvature, if any

Describe the signs of velocity and acceleration of an object given by this Position-time graph.
velocity = negative, accel = negative
velocity = positive, accel = negative
velocity = negative, accel = positive
velocity = positive, accel = positive

Describe the motion of an object given by this Position-time graph.
slowing down, moving backward
slowing down, moving forward
speeding up, moving backward
speeding up, moving forward

Describe the signs of velocity and acceleration of an object given by this Position-time graph.
velocity = negative, accel = negative
velocity = positive, accel = positive
velocity = negative, accel = positive
velocity = positive, accel = negative

Describe the motion of an object given by this Position-time graph.
slowing down, moving backward
slowing down, moving forward
speeding up, moving backward
speeding up, moving forward

Describe the signs of velocity and acceleration of an object given by this Position-time graph.
velocity = positive, accel = zero
velocity = negative, accel = negative
velocity = positive, accel = negative
velocity = negative, accel = zero

Describe the motion of an object given by this Position-time graph.
speeding up
slowing down
constant speed
not moving

Describe the signs of velocity and acceleration of an object given by this Position-time graph.
velocity = zero, accel = zero
velocity = negative, accel = zero
velocity = negative, accel = positive
velocity = zero, accel = positive

Describe the motion of an object given by this Position-time graph.
speeding up
slowing down
constant speed
not moving

Describe the acceleration of an object given by this Position-time graph.
positive acceleration
negative acceleration
no acceleration

Describe the motion of an object given by this Position-time graph.
slowing down
speeding up
slowing down then speeding up
speeding up then slowing down

Describe the motion of an object given by this Position-time graph.
not moving then moving backward
moving forward then not moving
moving backward then not moving
moving forward then backward

Given the Position-time graph below, during which interval is the object going the fastest?
0 s to 2 s
2 s to 4 s
4 s to 5 s

Given the Position-time graph below, what is the velocity at 6 seconds?
5 m/s
10 m/s
0 m/s
-5 m/s

Given the Position-time graph below, which way is the object moving at 3 seconds?
forward
backward
not moving
The location of an object related to a zero point.
position
speed
distance
displacement
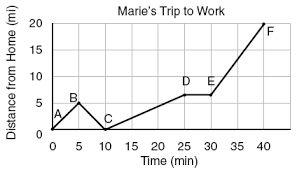
When was Marie driving the fastest?
C to D
D to E
E to F
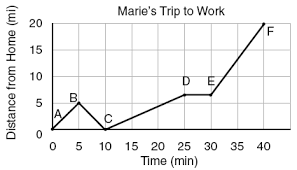
During what period of time was Marie stopped?
0-5 minutes
5-10 minutes
10-25 minutes
25-30 minutes
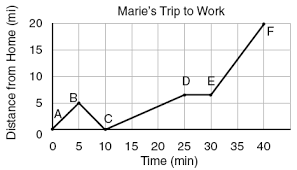
What could account for Marie’s motion at 27 minutes?
She was late so she broke the speed limit
She forgot something at home and ran back to get it
She was stopped at a red light
She was driving across the top of a hill
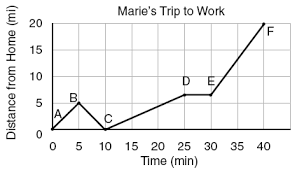
How does her speed at 3 minutes compare with her speed at 7 minutes?
She is driving faster at 3 minutes.
She is driving faster at 7 minutes
She is driving forward at 3 minutes and back at 7.
She is moving up at 3 minutes and down at 7 minutes
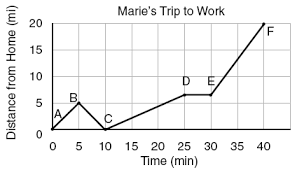
It usually takes Marie 30 minutes to get to work. Did her trip take...
The average amount of time.
Longer then average amount of time.
Shorter then average amount of time.
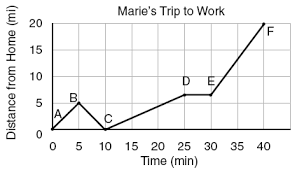
How far away is Marie's work from her house?
40 mi
25 mi
20 mi
5 mi
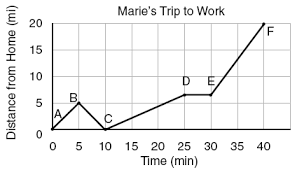
What could be a possible explanation for why Marie turned around at point B.
She arrived at work.
She forgot her lunch
She was waiting at a stop light.
She was sick and went home to sleep.
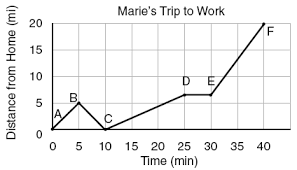
How far did Marie go before she turned around?
20 mi
5 mi
10 mi
25 mi

In Segment DE Marie was stopped at a red light. How long was she stopped for?
1 min.
10 min.
30 min.
5 min.
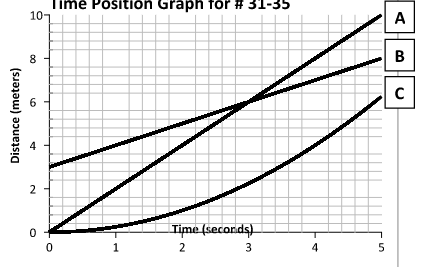

from 3rd second to 5th second, the object is
moving at a constant speed
speeding up
not moving
slowing down

What is happening at E?
Stationary
Accelerating
Fast steady speed; moving away from the starting position
Steady speed; returning to start position
This position vs. time graph shows an object...
not moving
moving with constant velocity
moving with changing velocity
This position vs. time graph shows an object...
not moving
moving with constant velocity
moving with changing velocity
This position vs. time graph shows an object...
not moving
moving with constant velocity
moving with changing velocity
Which of these position vs. time graphs shows an object changing direction?

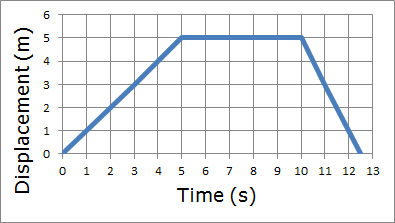
According to the graph, what was the Speed for the first 5 seconds?
1 m/s
0.5 m/s
5 m/s
2 m/s
What does the slope of a position-time graph represent?
Distance
Displacement
Velocity
Acceleration

Consider the graph shown below. Which description below is consistent with the graph?
The object moves slowly at a constant speed and then faster at a constant speed.
The object accelerates in the positive direction and then accelerates more rapidly.
The object moves forward, changes direction and then accelerates more rapidly.

Consider the graph shown below. Which description below is consistent with the graph?
The object accelerates in the positive direction and then in the negative direction.
The object moves upwards, reaches its peak and then falls with an acceleration.
The object moves in the positive direction and then moves in the negative direction.

What is the starting point of the object?
2 m
4 m
10 m
20 m

What is the average velocity of this object? Use slope equation.
+ 0.5 m/s
-0.5 m/s
+ 2 m/s
-2 m/s

Which one of the following graphs describes an object that is moving at a constant speed to the left (- direction)?
a.
b.
c.
d.
Which one of the following graphs describes an object that is at rest?
a.
b.
c.
d.
Which one of the following graphs describes an object that is moving at a constant speed to the right (+ direction)?
a.
b.
c.
d.

Which one of the following graphs describes an object that is moving to the right and slowing down?
a.
b.
c.
d.
What is the unit for velocity?
m
s
m/s
m/s/s
On a Position-Time Graph position is located on the _________.
x axis
y axis
On a Position-Time Graph time is located on the _________.
x - axis
y - axis
At 8 s what is the objects position?
2 m
4 m
10 m
20 m
What is the unit for position?
m
s
m/s
m/s/s
What is the unit for time?
m
s
m/s
m/s/s
Which of the following shows an object at rest?


Which of the following show an object moving in the negative direction?


Use the graph above and pick the most accurate description of the object's motion
object is moving at constant speed
object is speeding up
object is at rest
object is slowing down

Use the picture above to choose the most accurate description of the object's motion
object is at rest
object is slowing down
object is moving at a constant speed
object is speeding up

Use the picture to choose the most accurate description of the object's motion
object is moving at constant speed in the positive direction
object is speeding up in the negative direction
object is speeding up in the positive direction
object is slowing down in the negative direction

Use the picture above to choose the most accurate description of the object's motion
object is speeding up in the positive direction
object is slowing down in the positive direction
object is speeding up in the negative direction
object is slowing down in the negative direction

Which of the following velocity time graphs matches the position time graph above?


Which of the following velocity time graphs matches the position time graph above?

Which of the following velocity time graphs matches the position time graph above?

Displayed above is an acceleration time graph. Select all of the graphs below which match the acceleration displayed.


Which acceleration time graph matches the graph above?


Which acceleration time graph matches the graph above?

Which of the following graphs could match the acceleration time graph above?


Which of the following cases would lead to an object slowing down?
positive acceleration, positive velocity
positive acceleration, negative velocity
negative acceleration, positive velocity
negative acceleration, negative velocity
The slope of the velocity-time graph tells us the
acceleration
displacement
velocity
direction of travel
The slope of the position-time graph tells us the
acceleration
displacement
velocity
direction of travel

Which position time graph matches the velocity time graph displayed above?


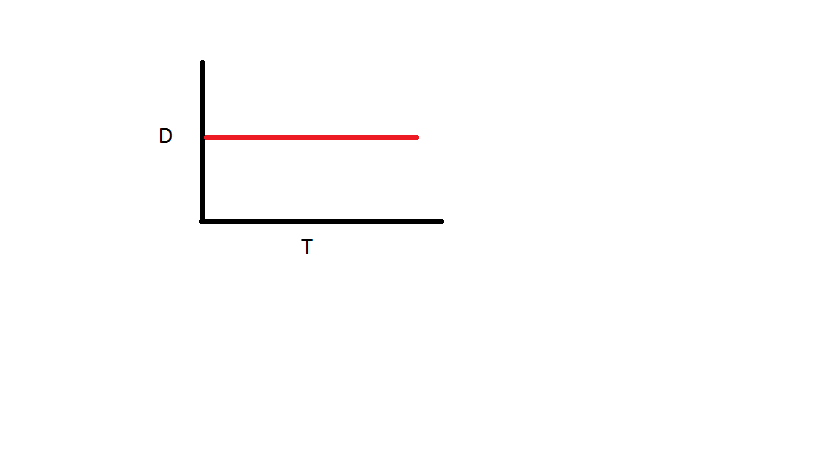
In the position vs. time graph, what type of motion does the line represent?
No motion
Constant velocity
Acceleration
Deceleration
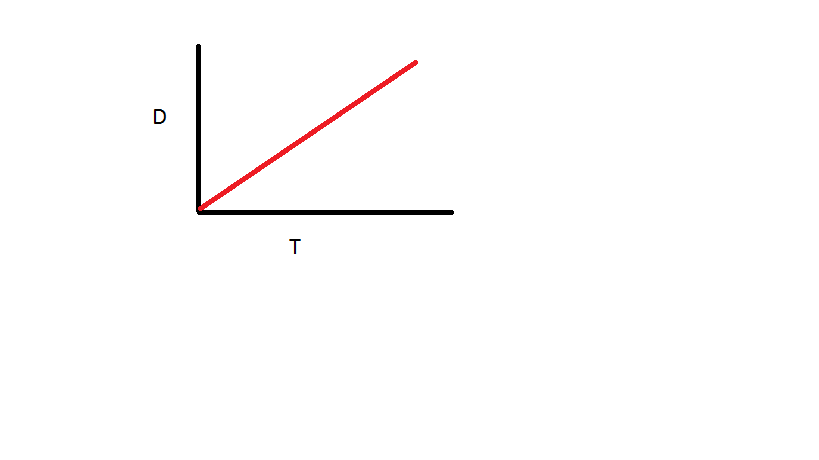
In the position vs. time graph, what type of motion does the line represent?
Acceleration
No motion
Deceleration
Constant Velocity

Select the graphs that would have the acceleration displayed above


Line A indicates that the object is
Speeding up in positive direction
Speeding up in negative direction
moving at constant speed in negative direction
moving at constant speed in positive direction

Around What time object is turning and moving in the opposite direction
2 sec
10 sec
4 sec
6 sec
What does the slope of a position-time graph represent?
Distance
Displacement
Velocity
Acceleration

Consider the graph shown. Which description below is consistent with the graph?
The object moves slowly at a constant speed and then faster at a constant speed.
The object accelerates in the positive direction and then accelerates more rapidly.
The object moves forward, changes direction and then accelerates more rapidly.

Consider the graph shown. Which description below is consistent with the graph?
The object accelerates in the positive direction and then in the negative direction.
The object moves upwards, reaches its peak and then falls with an acceleration.
The object moves in the positive direction and then moves in the negative direction.

What is the initial position of the object?
4 m
6 m
8 m
10 m
What is the average velocity of this object?
+0.5 m/s
-0.5 m/s
+2 m/s
-2 m/s
Which one of the following graphs describes an object that is moving at a constant speed to the left (- direction)?


Which one of the following graphs describes an object that is at rest?
Which one of the following graphs describes an object that is moving at a constant speed to the right (+ direction)?
Which one of the following graphs describes an object that is moving to the right and slowing down?

Which dot diagram shown is consistent with the position-time data?


During which stage is the object moving away from its starting point?
A
B
C
D
E
During which stage is the object moving toward its starting point?
A
B
C
D
E

Rank the following objects from slowest to fastest.
A-B-C
B-A-C
C-B-A
A-C-B
C-A-B

Which of the following lines (1-6) represent motion diagram A?
Graph Line 1
Graph Line 3
Graph Line 4
Graph Line 5
Graph Line 6
Which of the following lines (1-6) represent motion diagram B?
Graph Line 1
Graph Line 2
Graph Line 3
Graph Line 5
Graph Line 6

Which is true about plot c?
position is negative
velocity is positive
position is changing

At what time does this object have a negative velocity?
3 seconds
7 seconds
11 seconds
never

Consider the position vs. time graph below for cyclists A and B.
Do the cyclists start at the same point?
Yes
No

At t= 7s, which cyclist is ahead?
A
B

What is happening at the intersection of lines A and B?
The cyclists stop
The cyclists speeds are equal
The cyclists are at the same position at the same time.
At 7 seconds, this object's velocity is:
positive
zero
negative
can't tell from the plot



Which line shows the fastest velocity? (choose all that apply)
Line A
Line B
Line C
Line D
None of them

For the graph of the story : a student is walking home from school and stops to talk to a friend. While talking, he realizes that he forgot his bike at school and goes back to get it. He then rides his bike home. Which part matches up with Line segment A?
Walking home from school
Stops to talk to a friend
Goes back to school
Rides his bike home
None of them

Between which time intervals does the object speed up/increase velocity?(velocity moves away from 0 m/s point)
0-10 sec and 40-55 sec
15-30 sec and 40-55 sec
0-10 sec and 30-40 sec
15-30 sec and 30-40 sec
Between which time intervals does the object slow down/decrease velocity?(velocity move towards 0 m/s point)
0-10 sec and 40-55 sec
15-30 sec and 40-55 sec
0-10 sec and 30-40 sec
15-30 sec and 30-40 sec

What is happening at 0 m/min in the middle of segment C - D?
Nothing is happening
Change in speed
Change in position
Change in direction

Part D of the graph is from 55s to 95s. During Part D, the velocity values are all negative. What does negative velocity mean?
The object is slowing down.
The object is moving in the opposite direction now.
Part E of the graph is from 95s to 105s. Which of these statements is true about Part E?
The object's velocity values are negative.
The object's velocity values are positive.

At what time does the object switch directions?
15 minutes
40 minutes
10 minutes
30 minutes
Use the picture to choose the most accurate description of the object's motion
object is moving at constant speed in the positive direction
object is speeding up in the negative direction
object is speeding up in the positive direction
object is slowing down in the negative direction

Use the picture above to choose the most accurate description of the object's motion
object is moving with a constant velocity in the negative direction
object is speeding up in the negative direction
object is slowing down in the positive direction
object is moving with a constant velocity in the positive direction
Acceleration graphs have ______ on the y axis.(Choose 2 answers)
time
distance
speed
velocity
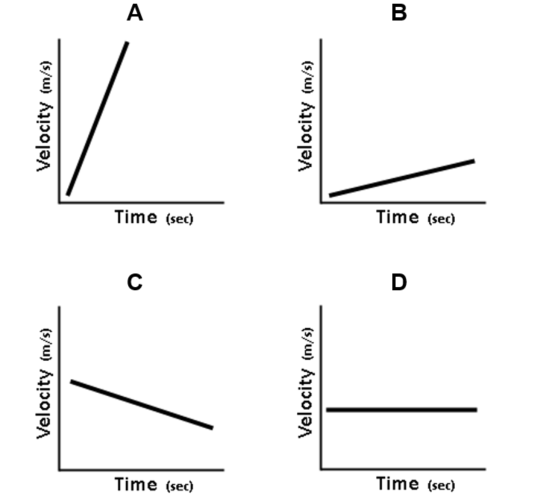
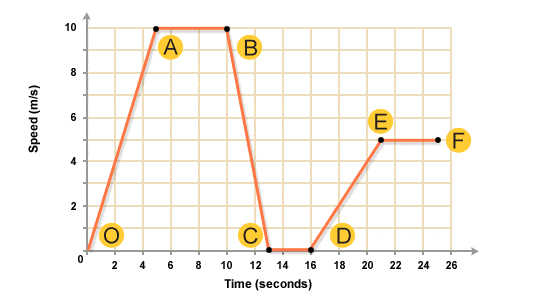

What is happening in section C?
going down a hill
speed is increasing
speed is decreasing

The graph shows
positive velocity that's getting faster
negative velocity that's getting faster
negative velocity that's getting slower
positive velocity that's getting slower

What is happening between 3 seconds and 4 seconds?
The object is moving in a negative direction.
The object is returning to its starting position.
The object is slowing to a stop.
The object is changing direction.
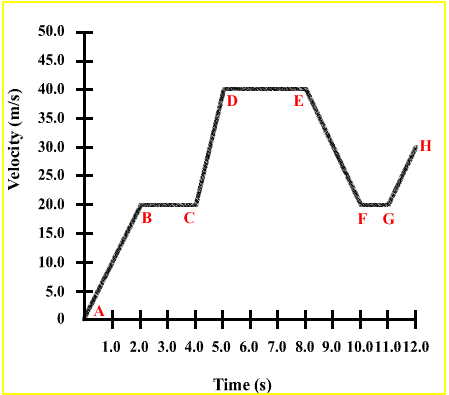
A negative acceleration means that your object is _____.
doing nothing
moving in circles
speeding up
slowing down
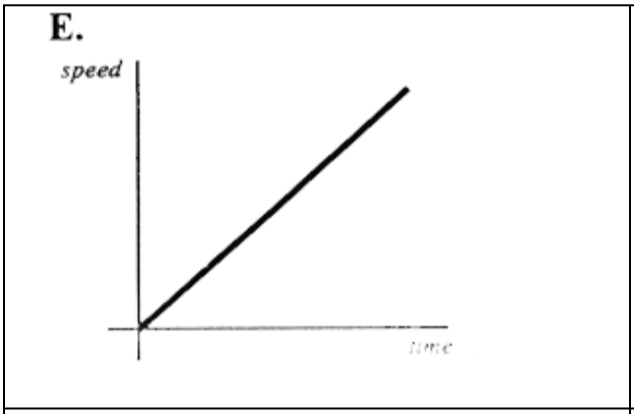
Match the graph to the description:
"The car is accelerating."
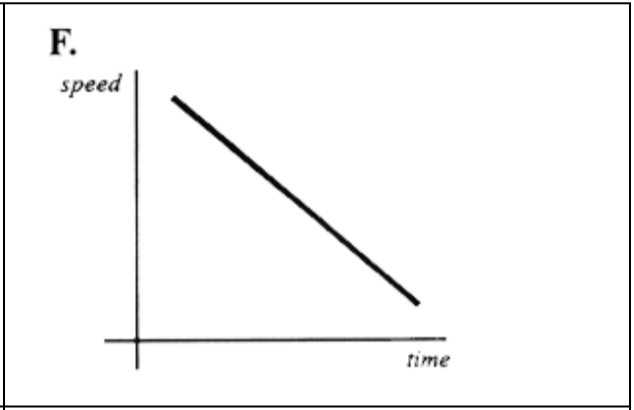
Match the graph to the description:
"The car is slowing down."

What is the motion shown in this velocity time graph?
moving with a constant positive velocity
Speeding up in the positive direction
slowing down in the positive direction
speeding up in the negative direction


Which graph might represent the acceleration of a jet plane moving down a runway from a rest position?
Graph 1
Graph 2
Graph 3
Graph 4

