Worksheets
Linear vs Nonlinear
Total questions: 62
Worksheet time: 3hrs 35mins

Is this graph a function?
Function
Not a Function

Is the graph pictured a function?
Yes
No

Is the graph pictured a linear or nonlinear function?
Linear
Nonlinear

Is this graph a function or not a function?
Function
Not a Function

Which graph is linear?
Graph A
Graph B
Graph C
Graph D

This is the graph of a linear equation
This is the graph of a non linear equation

Linear
Non Linear


Is this function linear or nonlinear?
Linear
Nonlinear

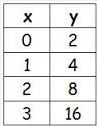
Is this function linear or nonlinear?
linear function
nonlinear function

Why is this function linear?
This is a linear function because it does not have a constant rate of change
This is a linear function because it creates a curved line.
This is a linear function because it has a constant rate of change.
This is a linear function because it's y-intercept is (0,2)

Is this function linear or nonlinear? (Hint: Look at the exponent!!)
Linear function
Nonlinear function

Is this function linear or nonlinear? (Hint: Look at the exponent!!)
Linear function
Nonlinear function
Which mapping diagram is not a function?


Identify all of the functions


Which is the set of all y-values or the outputs?
Domain
Range
Relation
Function
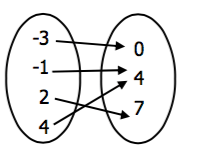
What is the range?
{-3, -1, 2, 4}
{0, 4, 7}
{0, 4, 4, 7}
{7, 4, 0}

What is the domain of a relation?
the set of all x-values
the set of all y-values
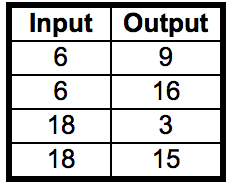
What is the domain of the relation shown in the table?
{12}
{6, 18}
{3, 9, 15, 16}
{13}
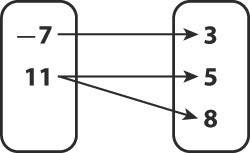
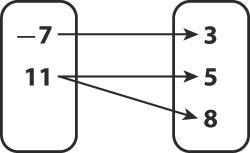
Is the relation shown a function?
No, because the x-value 11 is paired with 5 and 8.
Yes, because each x-value has only one y-value paired with it.


Which value is the slope in the equation:
y= 4x + 2
4
2
x
Which value is the y-intercept in the equation:
y= 2x -2
2
-2
1


Given the two points: (0, 6) and (6,18), write the equation of the line.
y = 2x + 6
y = 1/2x + 6
y = 1/3x + 6
y = 3x + 6
Why do we want to think of slope as a fraction?
rise/run
run/rise
Fractions make things better

Does this graph represent a linear or nonlinear relationship?
Linear
Nonlinear

Does this graph represent a linear or nonlinear relationship?
Linear
Nonlinear


Does this graph represent a linear or nonlinear relationship?
Linear
Nonlinear

Does this graph represent a linear or nonlinear relationship?
Linear
Nonlinear

Which statement is true?
Both Graphs have multiple y intercepts
Both graphs are not functions
The first graph is linear because it has a constant rate of change.
The second graph is nonlinear but has a constant rate of change.
What type of graph makes a straight line and can be written as y=mx+b or y=mx?
Nonlinear
Linear
Which of the following are nonlinear?


Does this graph represent a linear or nonlinear relationship?
Linear
Nonlinear
Does this graph represent a linear or nonlinear relationship?
Linear
Nonlinear
Does this graph represent a linear or nonlinear relationship?
Linear
Nonlinear
Does this graph represent a linear or nonlinear relationship?
Linear
Nonlinear
Which statement is true?
Both Graphs have multiple y intercepts
Both graphs are not functions
The first graph is linear because it has a constant rate of change.
The second graph is nonlinear but has a constant rate of change.
What type of graph makes a straight line and can be written as y=mx+b or y=mx?
Nonlinear
Linear
Which of the following are nonlinear?
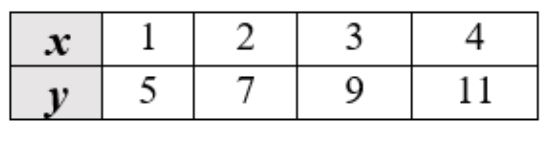
Is the function represented by the table linear or nonlinear?
Linear
Nonlinear
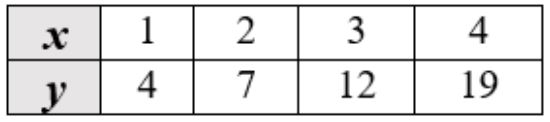
Is the function represented by the table linear or nonlinear?
linear
nonlinear
Why is this function linear?
This is a linear function because it does not have a constant rate of change
This is a linear function because it creates a curved line.
This is a linear function because it have a constant rate of change.
This is a linear function because it's y-intercept is (0,2)