Worksheets
Acceleration and Motion Graphs
Total questions: 25
Worksheet time: 38mins

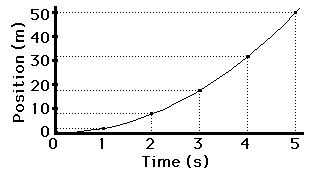

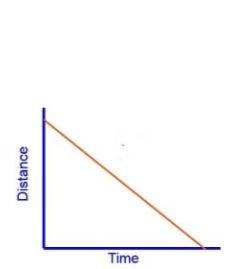
What is this line of this graph showing?
moving away from starting point at a constant speed
moving back towards the starting point at a constant speed
acceleration (getting faster)
deceleration (getting slower)

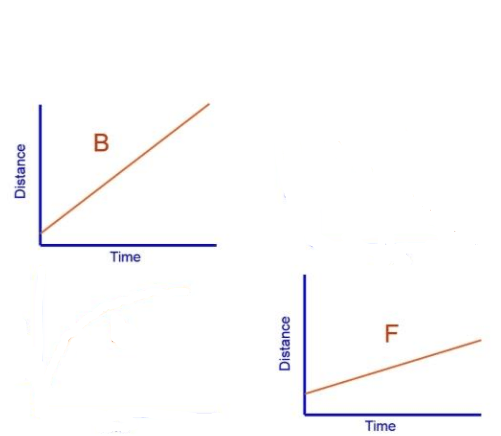


What happened during B to C point?
deceleration
constant speed
at rest
acceleration

What happened during E to F point?
not moving
increasing speed at a constant rate
constant speed
acceleration


What happened during A to B point?
not moving
increasing speed at a constant rate
moving at a constant speed
acceleration
Which one of the following is NOT consistent with a car which is accelerating?
A car is changing direction.
A car is moving with a high speed.
A car is moving with a decreasing speed.
A car is moving with an increasing speed.
A baseball pitcher delivers a fast ball. During the throw, the speed of the ball increases from 0 to 30.0 m/s over a time of 0.100 seconds. The average acceleration of the baseball is ____ m/s/s.
3.00
30.0
300
3000